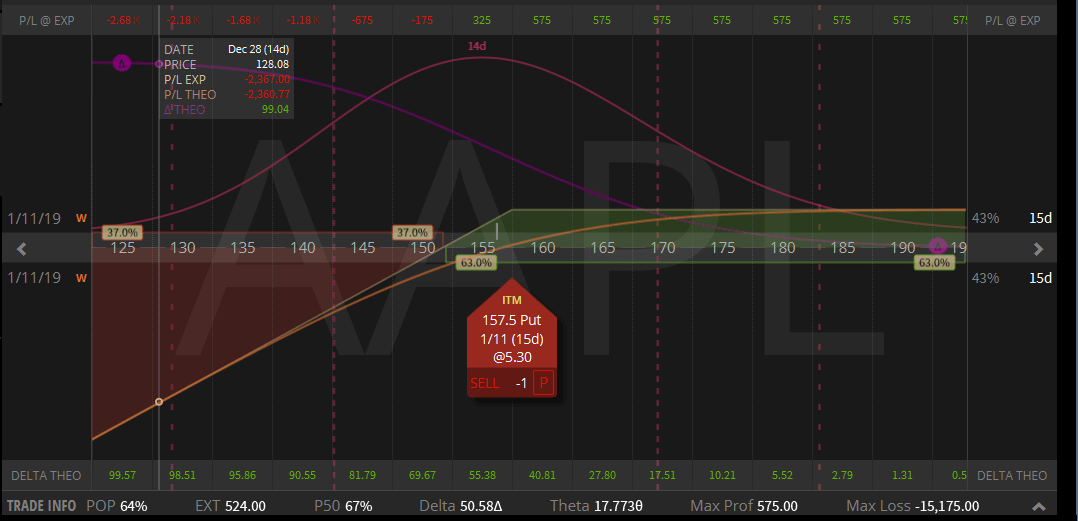
Is it more favourable to buy shares directly or to get assigned from a short put position. See the arguments and learn how to decide this question.
Year: 2018
Technical vs. Quantitative Analysis
Technical and quantitative analysis are two different types of market analysis. Both are based on price and historic market behaviour. Which is the one you should trust, which you should avoid?
An Algorithmic Stock Picking Portfolio
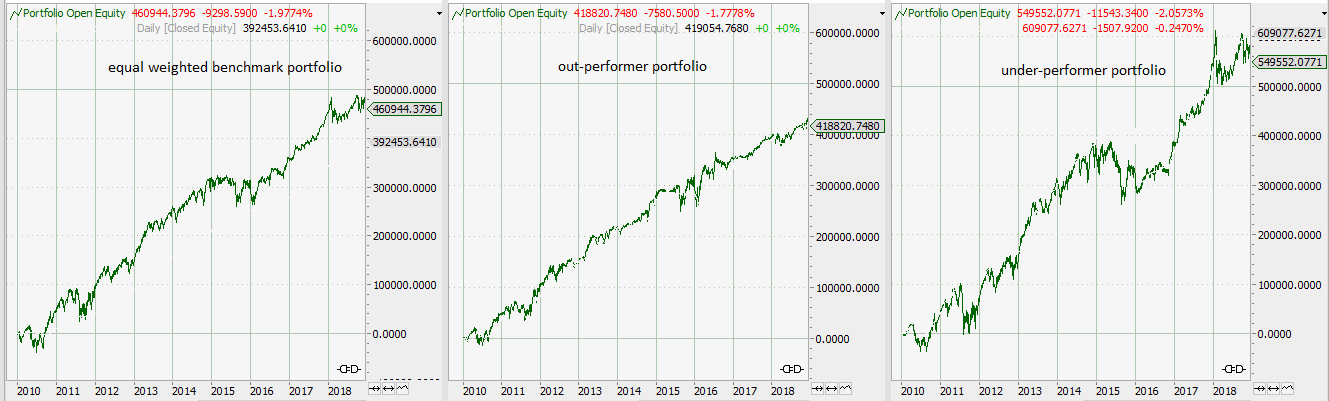
A volatility and return based stock picking algorithm. Portfolio construction, picking criteria and the ideas behind this approach. Excess returns of your portfolio against an equally weighted index portfolio.
The average move of a market
Markets have a high degree of randomness (and madness), but there are some things which hardly change over time. One is the width of an average market move before a counter-move can be observed.
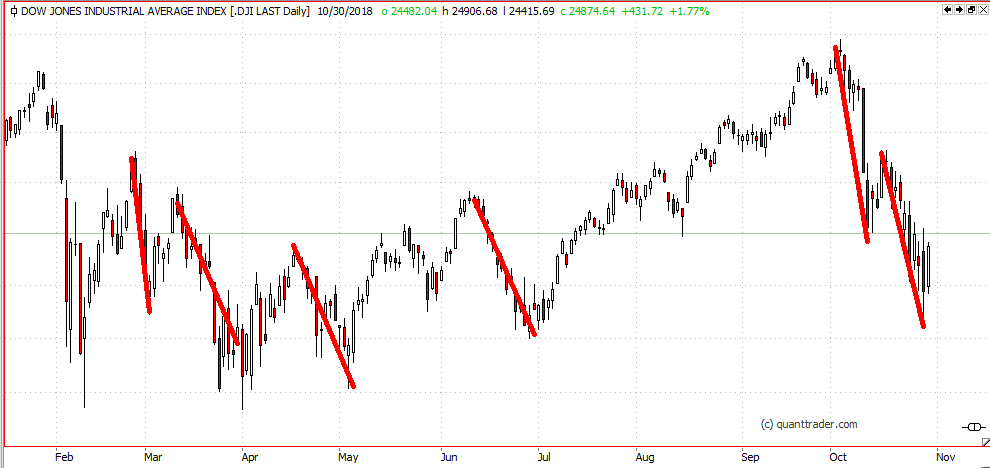
Market crash or market correction?

The difference between a crash and a market correction. VIX and realized volatility give the answer
Bollingerband: The search for volatility
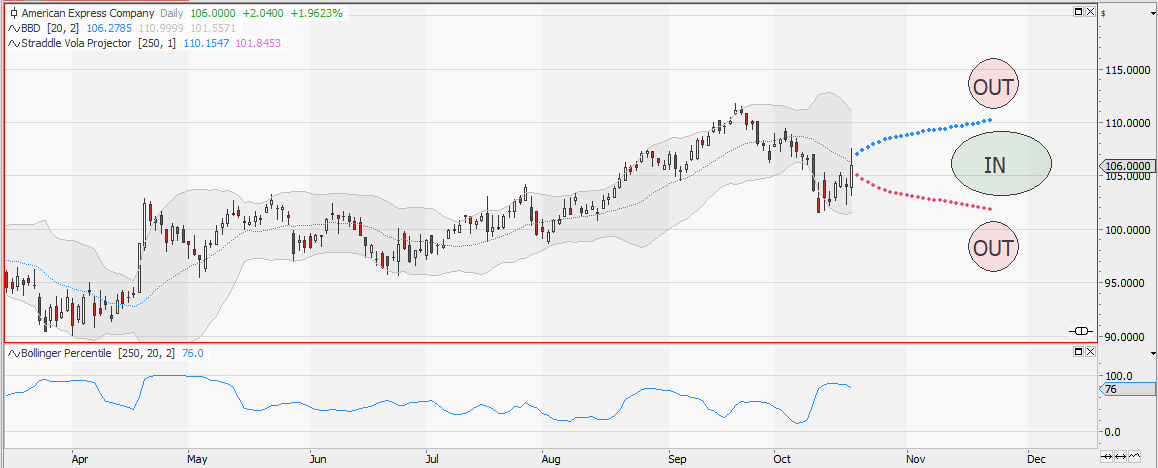
Will the market stay within it’s normal distribution range or will there be a breakout of this range? The Bollinger percentile indicator will give the answer.
Weis Wave indicator code for Tradesignal

The Weis Wave indicator for Tradesignal combines volume and trend information to detect turning points of the market.
Tradesignal Implied Volatility and IV Percentile Scanner
Use free data from the web and load it into Tradesignal to scan for implied volatility and IV percentile. Full code given for free
IV Percentile – when to sell volatility
IV percentile and IV rank both describe implied volatility. Which one is better in finding out if it is time to sell volatility? Read the answer in this article
The Hindenburg Omen – Stock Market Crash Ahead?
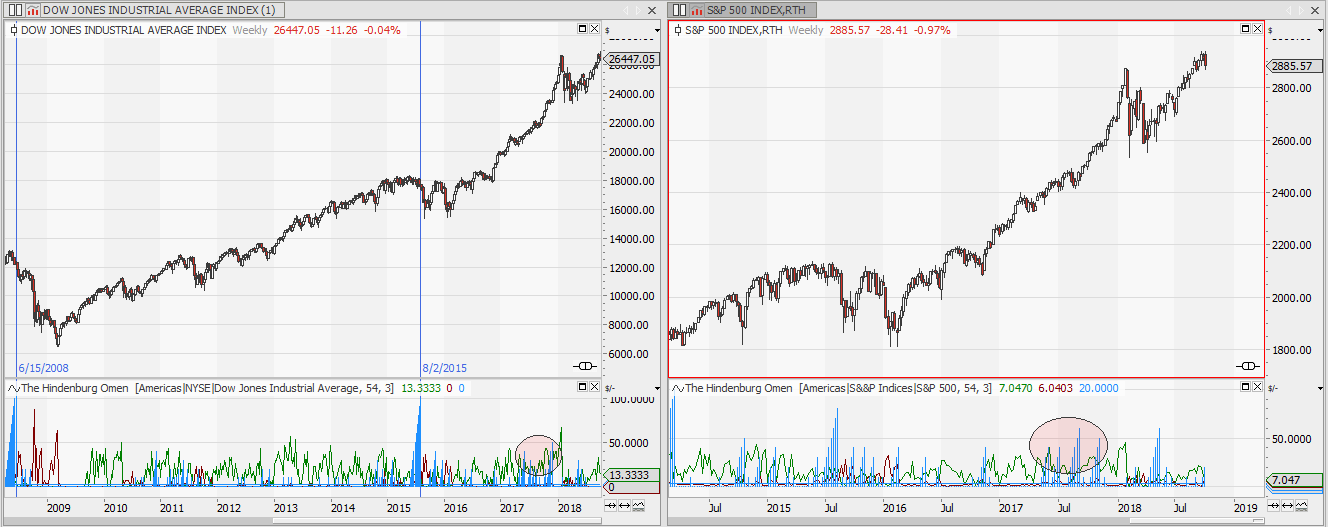
The Hindenburg Omen is a market breadth indicator analyzing new highs and lows on the market. It signals the end of the current bull market. Tradesignal Indicator Code is provided
Implied vs. Realized Volatility for NASDAQ100 stocks
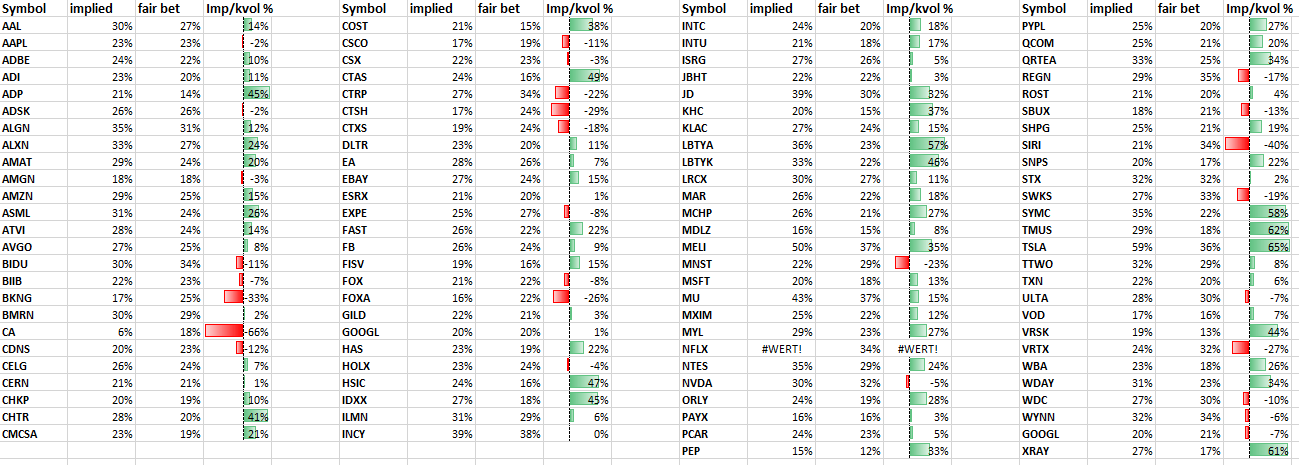
Comparing implied volatility to realized volatility can show you the right stocks to sell volatility. An overview over the implied and long term realized volatility of NADAQ100 stocks is given.
Distribution of Returns
“Tomorrow never happens. It’s all the same fucking day, man. ” Janis Joplin
Bet on Bollinger
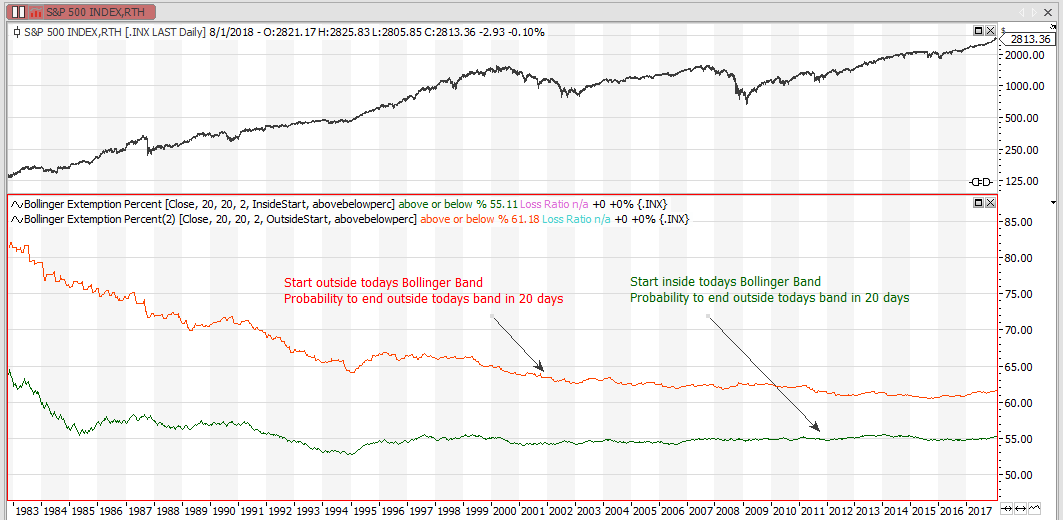
Ever since John Bollinger introduced his Bollinger Bands in the early 1980s the bands have been a favourite indicator to all technical trades. This article is about the prediction capabilities of Bollinger bands.
Scanning for Support and Resistance Probabilities
Scanning a market for support and resistance levels which will most likely not be penetrated in the near future is key for strategies like short options or vertical spreads. This article hows how RSI can be used to solve this problem.
Weekend Reading Recommendation

The markets will go up and down, and usually it’s not my business why they do it, I am just interested in making my luck with a position on the right side of the trade.
Backtesting Market Volatility
Backtesting if historical volatility or Kahler’s volatility gives a better prognosis for future volatility. Calculating the average prediction error of these two volatility indicators. Testing for the influence of data points used on the quality of the prediction. Comparing the findings to implied volatility to generate a trade idea.
Demystifying the 200 day average
The 200 day moving average is a classic of technical analysis. but is there any edge or statistical significance in it? How do equity and Forex market differ when it comes to this indicator? See the analysis and the answer to these questions.
Google EOD csv stock price data download
Sometimes my data provider has not got the data I am looking for. Searching for downloadable csv data I recently came across google spreadsheets. It provides an easy way to get historical stock price data. Save it as csv and use it with your Tradesignal.
Money for nothing
We already had a post regarding the mean reverting tendency of Volatility, now it`s time to make some money using this information.
Seasonal trouble ahead
Seasonal Projection and Volatility prognosis for german DAX. Trouble ahead…