A self optimising moving average

Different markets and different timeframes will need different moving average periods. This article will show a way to construct a self optimising moving average, one which automatically adjusts its period to the charted market and timeframe.

Reading a simple moving average

I would like to start this new indicator with some thoughts about how to define how “good” a moving average is. Usually my (simplified) standard interpretation of a moving average is, that when it rises and the market trades above the average, I am in bullish mode and would expect the market to rise over the next  bars. This very simple interpretation of a moving average can be quantified, meaning that I can calculate a measure to judge if my assumption is any good. To do so, I just count the number of bars which have been rising and falling while (initial condition) the market has been above the average and the average has been rising. This will give me a number, and let’s say on 52% of the bars in history when the initial condition was met, the market rose on the day after. As the chance is better than 50%, I would conclude that the analysed average is a useful one.

Self optimising moving average

Instead of just analysing one specific moving average length one could calculate the metrics for all moving averages. The sample implementation (code at the end of the article) will calculate all moving averages within a given parameter range (eg. 5 bars to 200 bars), calculate the winning percentage (rising bars) on the next bar, and then pick the best performing period length.

self optimising moving average

self optimising moving average

The moving average on the chart above constantly changes its period to the period, which would have given the best indication in history. As the original criteria has been to maximise the percentage of up-moving bars when the market is above the average and the average is rising, the shown moving average will always be the one which will give you the highest probability of a rising bar (next bar) if the average is rising and the market is trading above it. These periods are shown in green. Otherwise, if the criteria is not met or the winning percentage is below 50 (=no average has a better than 50:50 prediction capability), the indicator is colour coded red.

Advantage of the perfect average

Beside plotting the best moving average, one could also plot the statistics of the best moving average. This would be the percentage of winning bars when the original criteria is met.

best average statistics

best average statistics

The chart above shows a comparison of 3 different timeframes. A daily, hourly and 5 minute chart. The indicator below shows the edge the best moving average would give when trying to predict rising bars. A level of 5 would mean that you got a 55% chance for a rising bar when selecting the best performing period for your moving average and the average is rising and the market trades above it.

Using the self adjusting average this way, you can easily see in which timeframes or markets a moving average prediction model would be useful. On the chart above you obviously do not want to use this simple indicator interpretation on a 5 minutes chart. If the indicator is colour coded in red, either the market is not trading above the best average, the best average is not rising, or it would give no edge when trying to predict the next bars move.

Stability of results

As the indicator is based on a statistic over a given period of time, we have to think about stability and outliners. To remove outliner results, the statistics are smoothed. Instead of taking the winning percentage for a given average length, also the 2 results to the left and right are taken into account. The indicator can also plot these smoothed results, so you can see the edge the average prediction would offer with different periods.

On the chart below, the magenta histogram on the right shows the historic edge (smoothed) over the tested periods for the averages. From length 7 to length 148 all results would have been positive (a better than 50:50 chance for a rising bar), the best result was obtained with a period of 31. Observe this with different lengths of history, and you will get a good guess if your market is the right one for this kind of analysis. If the edge is not above 50% with a lot of periods, then this prediction will hardly be useful.

best period average complete

best period average complete

Link to indicator source code

Find the indicator code over here. The code is written in Equilla, the scripting language of the Tradesignal software.

The indicator uses all available data on the chart to calculate the statistics. You can set the range of periods you want to analyse. If you would like to backtest the indicator (go long when green) then just add the line below at the end of the code (used as strategy)

best period average backtest code

best period average backtest code

Continue reading

RSI Hellfire Heatmap Indicator

Chart analysis is all about visualizing data. The RSI hellfire indicator uses a heat-map to visualizes how overbought or oversold the market is on a broad scale. This helps to get a broad picture of the current market setup.

Multiple Time-frame Relative Strength Index

Wells Wilder’s RSI is an old timer of technical indicators. It tries to find out if markets are overbought or oversold. Usually it is calculated using a 14 bar setting. But a 14 bars RSI on a daily chart will give a different reading than 14 bars on an hourly or weekly chart. As it is always nice to see what traders on a different time-frame see on their charts, you could simply display several RSI settings on your chart. Continue reading

Bitcoin – end of the bullish bubble

Bitcoin has come a long way but now it is time to say good bye.

Being a trend following trader on the long side, the chart right now suggest anything else but a trend following long strategy. It might all look completely different in a few weeks or months, but right now the bitcoin market is done. The ichimoku scanner indicator still shows 100% bullish, but have a look at the history and the formed indicator-market patterns:  As marked on the chart we can see a nice bearish divergence. This is not a long entry signal!


Lower highs, lower lows; goodbye bitcoin, loved to trade you, but with a bearish behavior like now you are not my friend any more.

Continue reading

Bitcoin Trading Strategy – review of returns

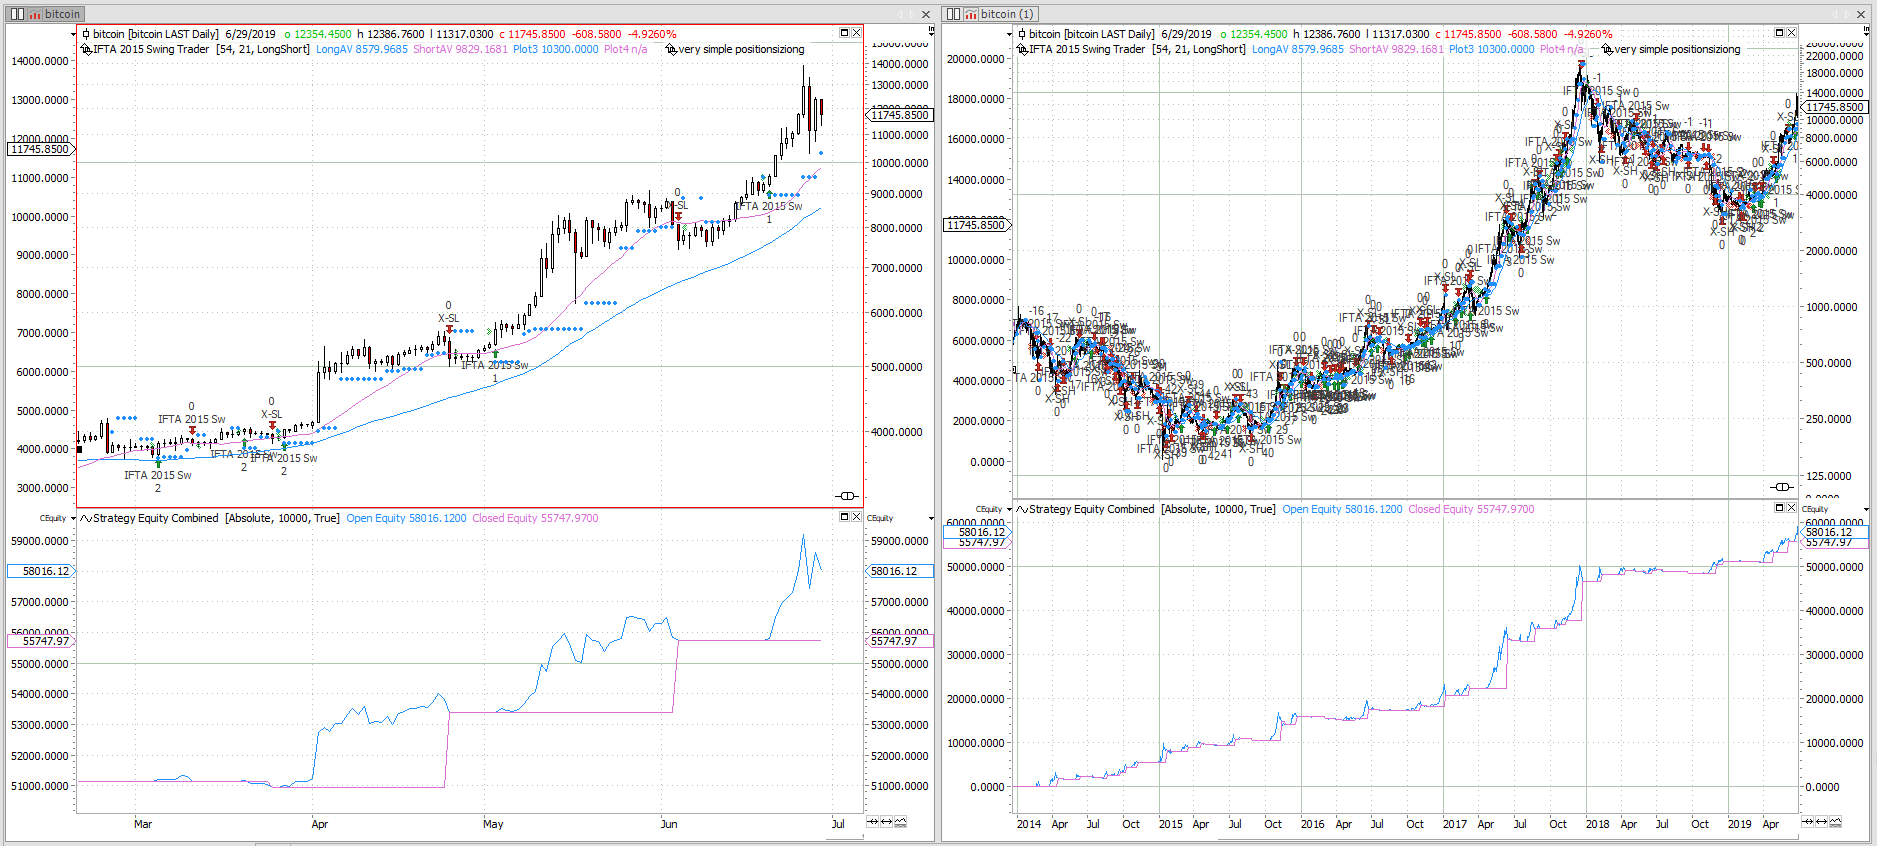
Bitcoin is not as bullish as it used to be. May it be due to fundamental reasons like transaction cost and slow speed, or maybe the herd found a new playground, whatever it might be, it is a good time to have a look how my bitcoin trading strategy performed.

The bitcoin trading strategy uses two moving averages for the trend detection, and, when the averages say bullish, the strategy will buy if the market moves above it`s old swing high.

The position is protected with an exit at the last swing low and a 3% trailing stop.

But have a look how this simple strategy performed over the last two years:

Trading on a daily timeframe and investing 10000€ with each entry, the strategy managed to get more than a 100% return over the last 2 years.

Continue reading

Bitcoin Handelsstrategie

Die Cryprowährung Bitcoin ist zurück!

Sie erlebte ihren Hype vor 2014, doch ging es seitdem fast nur noch bergab. Nach den Hochs um 1000$ für einen Bitcoin Ende 2013 verfiel der Preis bis auf 150$. Doch diese Zeiten scheinen vorbei zu sein, bitcoin is back!

Bitcoin Chart Analyse

Der Chart zeigt den Bitcoin / USD Verlauf der vergangenen 3 Jahre. Es spring sofort ins Auge, dass die lanfristige  fallende Trendlinie im Juni 2015 gebrochen wurde. Seitdem ist neben den Kursen auch das gehandelte Volumen stark am Steigen. (Kurs- und Volumsdaten von  bitstamp.net)

Bitcoin Chartanalyse

Noch immer ist die Volatilität des Marktes extrem hoch, Bitcoin ist ein reines Spekulationsobjekt, beliebt bei Leuten mit Hang zur Weltverschwörung.  Dies sind die besten Voraussetzungen dafür, dass eine automatisches Bitcoin Handelssystem funktionieren kann. Die hohe Volatilität ermöglicht zudem mit geringem Kapitaleinsatz ansprechende Gewinne.

Bitcoin Handelsstrategie

ich bin nicht an die Börse gegangen um mir den ganzen Tag Gedanken über Trendlinien zu machen, ein automatischen Handelssystem für Bitcoin ist da schon eher mein Ding.

Meine Bitcoin Handelsstrategie basiert auf klassischem Swing Trading. Die Strategie selbst wurde auf von mir auf der IFTA Konferenz in Tokyo vorgestellt, IFTA Mitglieder können den vollständigen Systemcode auf der Webseite http://www.ntaa.or.jp/ laden.

Die Basis des System sind die Swing Punkte.

Bitcoin Swing Points

Eine programmierte Definition dieser Punkte finden Sie im Swing Point Stop

Kombiniert man diese Swing Punkte mit einer einfachen Trenderkennung, ergibt sich ein hoch profitables Bitcoin Handelssystem.

Bitcoin Trading Strategy

Bitcoin Handels Regeln:

Continue reading

Bitcoin Revolution

bitcoin revolution

Cryptowährung Bitcoin

Die digitale Währung Bitcoin scheint nicht mehr aufzuhalten. Immer stärker wird die Verzahnung mit der Realwirtschaft, immer mehr Händler nehmen Bitcoin als Zahlungsmittel, immer mehr institutionelle Anleger können diesen Markt nicht mehr ignorieren.

Ich verbrachte die letzten 2 Tage mit Davide Capoti, Emanuele Colacchi und Matteo Maggioni in Rom. Die 3 sind institutionelle Commodity Händler für einen der größten italienischen Marktteilnehmer.  Und als professionelle Händler schrieben Sie eines der professionellsten Bücher zu diesem Thema, derzeit leider nur auf italienisch erhältlich.

Bitcoin Trading

Das Buch Bitcoin Revolution ist in 3 große Abschnitte geteilt.

Continue reading