Intraday Volume Analysis

Many algorithmic trading strategies use volume to verify the accuracy of a signal. For example, when your strategy indicates a breakout, you may want to look for unusually high volume. On the other hand, if you are seeking a congestion area, you may want to look for unusually low volume. This is a basic consideration when using daily charts, as you can often just use a moving average or Bollinger band on volume to determine if the current volume is high or low.

daily volume analysis using a moving average

daily volume analysis using a moving average

Intraday Volume Analysis

Analyzing intraday volume is not as straightforward. Averaging the volume of all intraday candles is not useful because market conditions vary at different times. For example, the Asian, European, and American sessions in a 24-hour market will likely have different volume profiles, so it would not make sense to compare the volume at 2 AM to the volume at 4 PM to determine if the 4 PM volume is exceptionally high or low. Instead, you should compare the 4 PM volume to the average volume at 4 PM to get a meaningful comparison. A simple moving average on volume unfortunately is not time sensitive, thus can not be used for this comparison.

Another important factor that many traders overlook is that the average traded volume also varies depending on the day of the week. For example, the average volume on a Monday might be 15% lower than the average volume on a Wednesday. Therefore, if you compare Wednesday’s volume to the average volume on any day, you may get an incorrect indication.


intraday volume profile per weekday

intraday volume profile per weekday

The chart above shows the average volume in dependence of time (GMT+1) and weekday (1=Monday)  for light crude. As you can see the traded volume has quite some variability, so just averaging the complete day would not tell you if the current volume is high or low.

Intraday Volume Analysis Indicator

To address these issues, I developed an indicator that accounts for these points. It averages the volume in a way that only averages times and weekdays that are the same.

For example, if today is Thursday at 2 PM, the indicator will use all Thursday 2 PM candles and calculate the average for this specific time and day of the week. This way, you will get the most accurate average volume for a specific intraday candle and can easily see if the current volume is higher or lower than the average.


intraday volume analysis indicator

intraday volume analysis indicator

Volume Analysis Indicator – Tradesignal Equilla code

Coding the Indicator in Tradesignal is quite straight forward and done with a few lines of code. It creates a 2 dimensional timestamp/weekday array and stores all data on the chart in the appropriate cells. Then the average volume for the specific time/weekday is calculated and displayed.

intraday volume analysis indicator code

intraday volume analysis indicator code

Please read the small print before using the indicator and leave a comment / backlink if you convert it to some other software / programming language.


Detecting Excess Market Moves

Sometimes markets move too fast and too far. This article is all about a new method to detect excess market moves. A new indicator will be presented, which overcomes many of the downsides of traditional ones like RSI or Bollinger Bands.

Overbought and Oversold Indicators

I am sure you are familiar with the traditional indicators RSI and Bollinger Bands. Legions of analysts have used them to detect excess market moves and market reversals. You might have used a RSI reading above 70 or below 30 or a market close outside of a 2 standard deviation Bollinger Band to do so. But these traditional indicators have a big downside: they are always calculated over a given period of time: 14-bar RSI, or 20-bar Bollinger Bands. You can surely adjust this setting to your market, but who tells you that e.g. a 17-bar calculation period is better than taking the last 14 or 20 bars into account? Going this way is a slippery road and you might fall down the cliffs of curve fitting.

classic excess indicators

classic excess indicators

A new algorithm for excess detection

Bollinger Bands already has the key ingredient for a useful reversal detector: it measures the market move in standard deviations. But it does the measure only over a fixed interval setting, thus missing a lot of shorter or longer excess market moves.

To overcome this restriction and find all excess moves, I did me an indicator which searches for excess moves over multiple intervals. This is how it works:

First the algorithm calculates a volatility measure. All data on the chart, prior to the testing bar, is used. The formula used is described over here. After the volatility of the market has been calculated, the algorithm measures all market moves for a given number of bars. A standard setting might be to calculate all moves between 5 and 200 bars. From this list of moves, normalised in volatility multiples, the algorithm picks the biggest moves. Then a trigger value is applied and the algorithm checks if the biggest move found is more than e.g. 3 times the expected volatility. To show the found move on the chart, the algorithm waits for another bar, and if this bar does not form a new low for bearish moves or a new high after a bull move, the move is shown on the chart. A reversal or at least an end of the exuberant market move can be expected.

market excess detection

market excess detection

On the chart above you see this new indicator in action. The right chart is Bitcoin on an hourly timeframe, the right one is German power on a daily timeframe. Both charts use the same settings and search excess moves with a length of 5 to 200 bars. The lines are fixed (confirmed) with a 2-bar counter move.

Some examples for excess detection indicator

To see the effect of different settings have a look at the chart below. All 3 charts detect moves between 10 and 200 (hourly) bars. A 1 bar confirmation delay is used. The difference between the charts is the minimum volatility multiple which is used to detect the excess. From left to right it uses a 1, 3 and 5 times the average fair bet volatility to define the minimum move.

Kahler excess detector - different settings

Kahler excess detector – different settings

Statistical test of excess indicator

If this indicator is any useful, the market should show a different behaviour on the bars after an excess move has been detected than on an average day. To see if this is true the signal efficiency can bet tested using the methodology described in an earlier post.

excess detector test

excess detector test

The chart above shows the excess detector applied on daily JPY Forex data. Only bullish reversals are detected. On the right side you see the average profit factor for the days after a reversal (2*vola, 1 bar confirmation) has been detected. Although it has been a falling market (magenta benchmark below 1) the signal generates showed an average profit factor of more than one – a strong indication that this indicator is able to predict a bullish move after a sell off has been detected. Even in an overall bearish market.

Usage and general thoughts

There is no indicator which will tell you what the future will bring, but a good indicator will flash a warning sign if the current state of the market is going to change. My excess indicator, like Bollinger Bands and RSI, will tell you when the markets have moved too far. It does this detection independently from a fixed period setting. You have to decide which timeframe you are interested in, e.g. short term = 3 to 10 bars, mid term=10 to 21 bars, long term=21 to 200 bars, and then use the signals of this indicator as a setup to your trading strategy.

If the indicator tells me that there has been an excess bearish move, I will not set up a new short position. I neither would set up a long position if this sell off happened in a bearish market. But I will think about using a tight trailing stop to lock in the profits of my short position.

If there has been an excess bearish move in an uptrend, I might want to start to scale into a long position, using a tight stop loss at the beginning and the let it run until my indicator flashes a warning sign in the other direction.

Never forget that money is made with position sizing and risk management, although a nice indicator can help… :)

Tradesignal Indicator Code

You can download the source code of this indicator as a txt file. Copy and paste the content of the text file into a new indicator in Tradesignal and start exploring.  You will need the latest version of TS (10.2) and have a chart with at least 1000 bars of data. By downloading the indicator you are accepting the smallprint.

Kahler’s Excess Detector


Z-Score Factor Portfolio Weighting

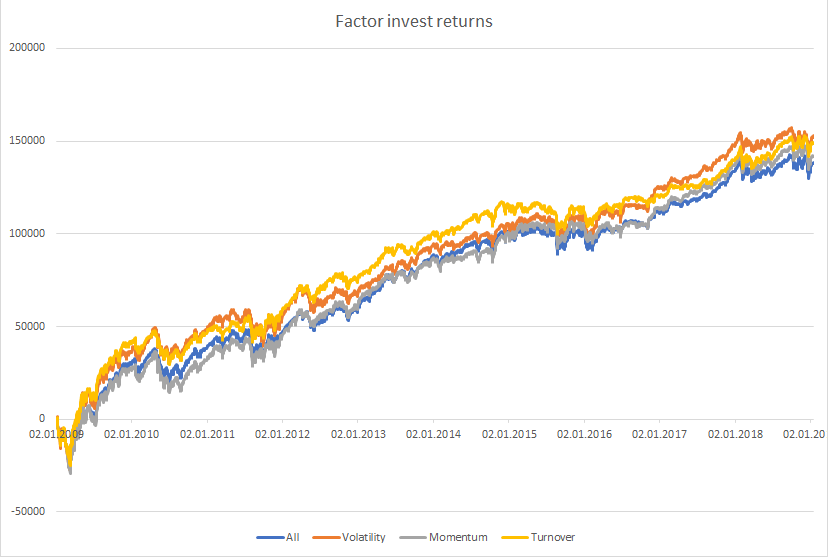
Technical Indicators can be used for timing and weighting strategies. Using momentum as an example, you could go long if the momentum turns positive, or you could dimension the weight of your position depending on the level of momentum. Applied on a portfolio of assets, this would be called factor investing. This article will show you a way to weight your portfolio using factors. Continue reading

The coastline paradox and the fractal dimension of markets

Coastlines are fractal curves. When you zoom in, you will see similar shaped curves on every scale. The same is true for market data. On a naked chart you can hardly tell if it is a daily or hourly chart. This article will explore this feature of crinkly curves and show how much markets and coastlines have in common.

The coastline paradox

When trying to measure the length of the British coastline you will quickly notice, that the length measured depends on the length of the ruler you use. The shorter the ruler, the longer the measured length of the coastline.

When measuring a straight line, the length of the ruler has no influence. You can measure 1 meter with a 1cm ruler applied 100 times or with a 50cm ruler applied 2 times. Both methods will give you the same result. Not so when measuring a crinkly line like a coast.

British coastline length paradox

British coastline length paradox (c) wikipedia

In 1967 Benoit Mandelbrot wrote a famous article in Science magazine about this problem. This was the birth of fractal geometry. The basic assumption was, that if a curve is self similar, this self similarity can be described by the fractal dimension of a curve. Self similarity means, that if you zoom into a curve, it looks similar on all zoom levels.

Coastline paradox in financial markets

Continue reading

Detecting Support and Resistance Levels

Support & Resistance levels are essential for every trader. The define the decision points of the markets. If you are long and the market falls below the previous support level, you most probably have got the wrong position and better exit.

The detection of support and resistance levels is usually highly subjective and based on the analysts experience. In this article I will use a simple algorithm to detect the levels and show them on the chart. Continue reading

Profit from large daily moves

Whenever the market shows an exceptional day ranges it is time to take bite. See how you can profit from large daily market moves.

Open-Close Range

When looking at any chart, you will surely notice that the large candles tend to close near the high or low. This is due to herding. Once the market is moving significantly, everyone hops on and the large move becomes even larger. This is true for daily, weekly and intraday candles.

The chart shows an indicator which plots the daily move. Every opening is set to zero and the absolute move of the day is drawn. Around these normalised candles a long term 2 standard deviation volatility band is drawn.  Right now the 2 standard deviation volatility for SPX is about +/- 46 points.

Take a bite before the market closes

As you can see this +/-46 point barrier above/below the opening of the day is a wonderful entry point. If you enter long 46 points above the opening and go short 46 points below the opening nearly all entries would have lead to a profitable trade. To get an even higher probability of success you can volume as a confirmation. Large moves must also show high volume. The exit is done at the end of the session. This analysis does not give any indication for the next days move. So be fast, take your bite and go home with a small profit and no overnight position.

No free lunch

On the chart it looks easy, but be careful. As an example the last bar shown on the chart first crossed the band to the downside, reversed and crossed above the upper band. So you will need to use a trailing stop to lock in profits and avoid to take the full -46 to +46 points trade as a loss!


Python Regression Analysis: Drivers of German Power Prices

German Power prices can be explained by supply and demand, but also by causal correlations to underlying energy future prices. A properly weighted basket of gas, coal and emissions should therefore be able to resemble the moves of the power price.  This article will introduce multivariate regression analysis to calculate the influence of the underlying markets on a given benchmark. It is an example of  a machine learning algorithm used in analysis and trading.

Multivariate regression analysis

Continue reading

How to detect unwanted curve fitting during backtest

Whenever you develop an algorithmic trading strategy, unwanted curve fitting is one of the most dangerous hazards. It will lead to substantial losses in real time trading. This article will show you some ways to detect if the performance of your algorithmic trading strategy is based on curve fitting.

Curve fitting – what is it?

Every algorithmic trading strategy will have some parameters. There is no way around it. You will have to decide what length your indicators have, you will have to specify a specific amount for your stop loss or profit target. Beside the actual rules of your strategy the chosen parameters will usually significantly influence the back-test performance of your strategy. And with any parameter you add the danger of curve fitting rises significantly. Continue reading

The Edge of an Entry Signal

When developing a new trading strategy you are usually confronted with multiple tasks: Design the entry, design the exit and design position sizing and overall risk control. This article is about how you can test the edge of your entry signal before thinking about your exit strategy. The results of these tests will guide you to the perfect exit for the tested entry signal (entry-exit combination)

Quality of an Entry Signal

When you develop a new idea for an entry signal there are two things you would like to see after the entry: no risk and fast profits. This would be the perfect entry with the highest possible edge. In reality the market response to your entry will be risk and chance. With a good entry the upside would outnumber the downside. Continue reading

The Edge of Technical Indicators

Classical technical indicators like RSI and Stochastic are commonly used to build algorithmic trading strategies.  But do these indicators really give you an edge in your market? Are they able to define the times when you want to be invested? This article will show you a way to quantify and compare the edge of technical indicators. Knowing the edge of the indicator makes it an easy task to select the right indicator for your market.

The edge of an indicator

Any technical indicator, let it be RSI, moving averages or jobless claims, has got a primary goal. It should signal if it is a wise idea to be invested or not. If this indicator signal has any value, on the next day the market should have a higher return than it has on average. Otherwise  the usage of no indicator and a buy and hold investing approach would be the best solution.

The edge of an indicator in investing consists of two legs.

  1. the quality of the signal
  2. the number of occurrences

Continue reading

Daily Extremes – Significance of time

Analyzing at which time daily market extremes are established shows the significance of the first and last hours of market action. See how different markets show different behavior and see what can be learned from this analysis.

Probability of Extremes

A day of trading usually starts with a lot of fantasies for the future, then we try to survive the day and end it with a lot of hope for tomorrow. This psychological pattern can also be shown when analyzing intraday market data. A high level of fantasies usually leads to a strong market movement, and thus market extremes can often be seen near the beginning or the end of the trading session. Continue reading