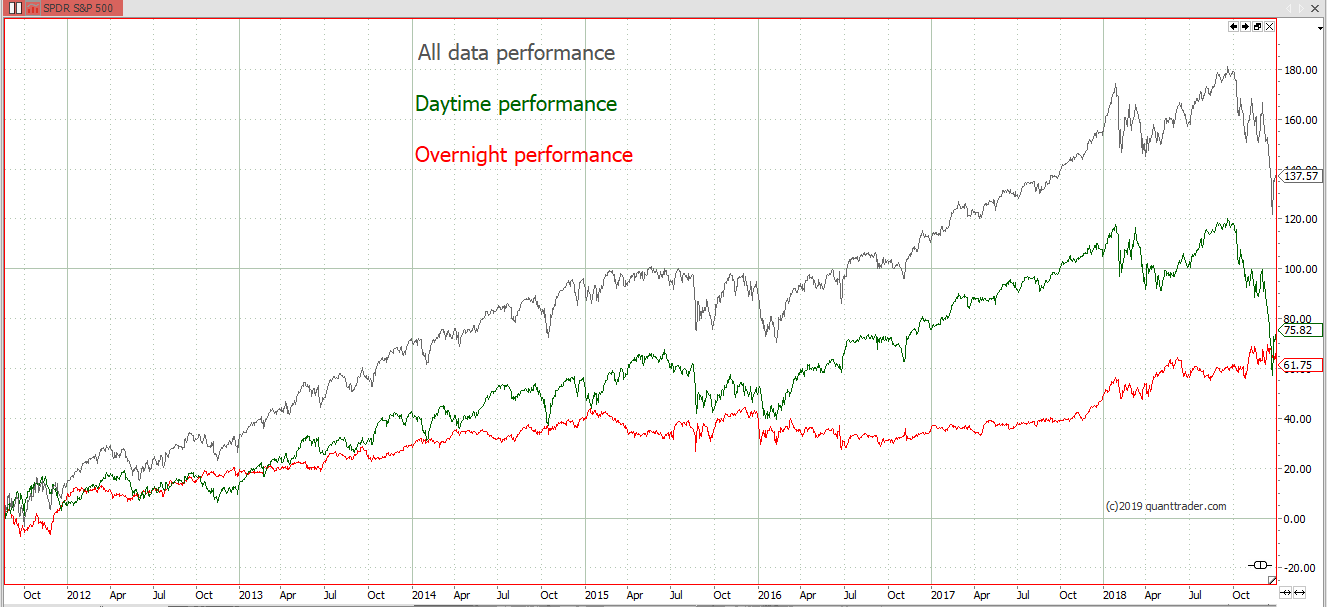
Over the last 20 years equity markets and ETFs did a significant part of their total performance over night. This article will examine the relationship of in-session moves vs. the out-of-session moves of ETFs and commodities.
volatility
Charting Probabilities
Charting is all about where you are and what might happen next. Seeing the statistical probabilities of further poves is surely a big help when thinking about the market. This article gives you a free set of indicator which will help you differ the likely from the unlikely. Continue reading
The magic of implied volatility
VIX and implied volatility in general is a measure of the expected market move. If VIX is trading at 50, the option market expects that the market will stay within 50% up or down within the next year. Continue reading
Profit from large daily moves
Whenever the market shows an exceptional day ranges it is time to take bite. See how you can profit from large daily market moves.
Open-Close Range
When looking at any chart, you will surely notice that the large candles tend to close near the high or low. This is due to herding. Once the market is moving significantly, everyone hops on and the large move becomes even larger. This is true for daily, weekly and intraday candles.
The chart shows an indicator which plots the daily move. Every opening is set to zero and the absolute move of the day is drawn. Around these normalised candles a long term 2 standard deviation volatility band is drawn. Right now the 2 standard deviation volatility for SPX is about +/- 46 points.
Take a bite before the market closes
As you can see this +/-46 point barrier above/below the opening of the day is a wonderful entry point. If you enter long 46 points above the opening and go short 46 points below the opening nearly all entries would have lead to a profitable trade. To get an even higher probability of success you can volume as a confirmation. Large moves must also show high volume. The exit is done at the end of the session. This analysis does not give any indication for the next days move. So be fast, take your bite and go home with a small profit and no overnight position.
No free lunch
On the chart it looks easy, but be careful. As an example the last bar shown on the chart first crossed the band to the downside, reversed and crossed above the upper band. So you will need to use a trailing stop to lock in profits and avoid to take the full -46 to +46 points trade as a loss!
VIX Futures spread trading
VIX futures are usually in contango, meaning that the next month future is quoting at a higher price than the current month VIX future. But this spread in not constant, and at the end of the expiry cycle an interesting VIX future spread trading idea comes to my mind…
End of cycle VIX futures spread trading
Having a look at the chart below you hopefully see the spread trading idea by yourself: Continue reading
The Probability of Normality
When selling implied volatility you want the market to stay within the expected range. But what is the historic probability that markets behave as expected? And what other analysis could be done to enhance your chances and find the periods when it is wise to sell an at the money straddle? This article will try to give some answers to this question.
The normal distribution cone
Daily Extremes – Significance of time
Analyzing at which time daily market extremes are established shows the significance of the first and last hours of market action. See how different markets show different behavior and see what can be learned from this analysis.
Probability of Extremes
A day of trading usually starts with a lot of fantasies for the future, then we try to survive the day and end it with a lot of hope for tomorrow. This psychological pattern can also be shown when analyzing intraday market data. A high level of fantasies usually leads to a strong market movement, and thus market extremes can often be seen near the beginning or the end of the trading session. Continue reading
Noisy Data strategy testing
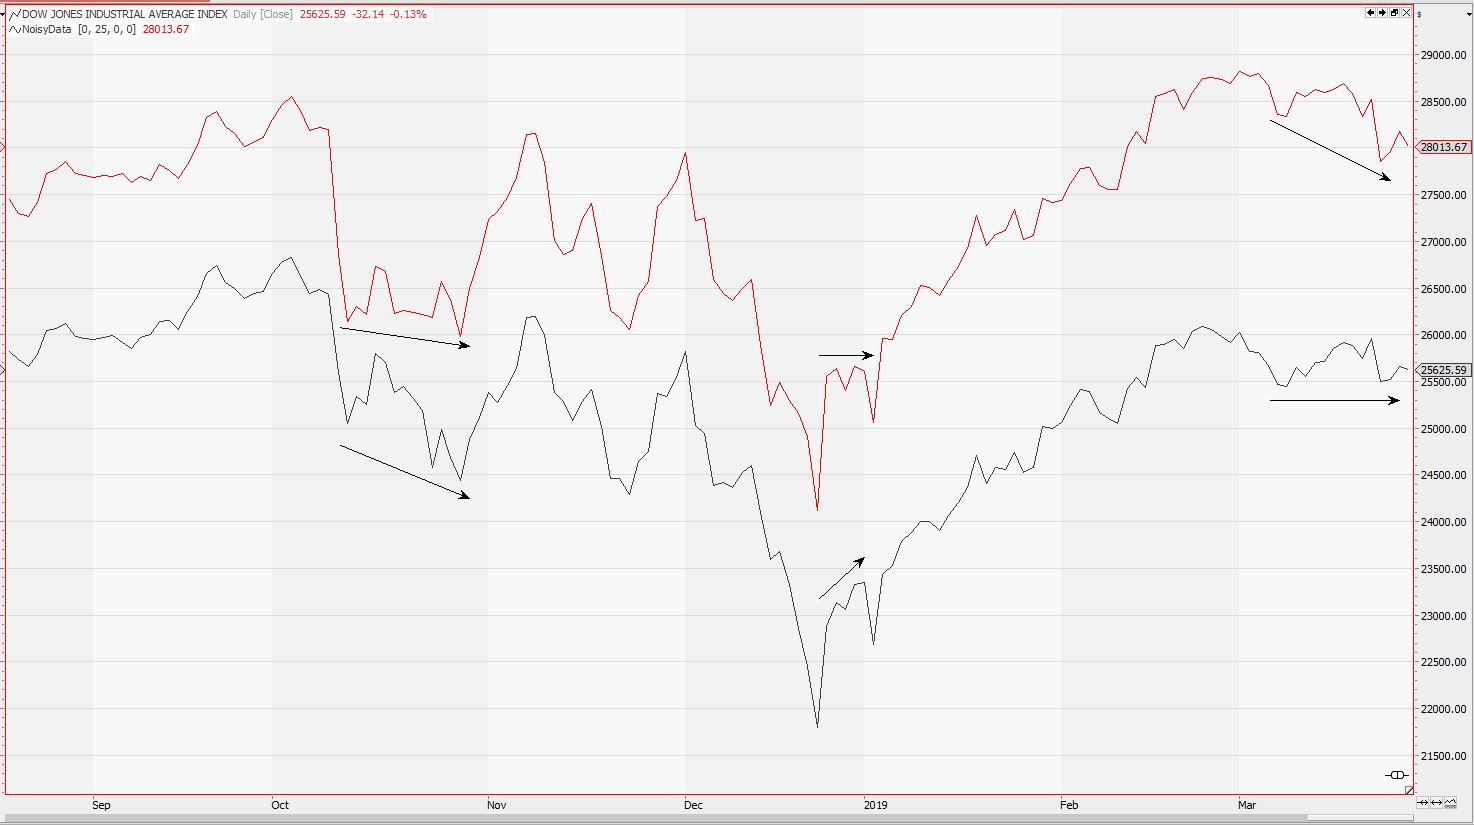
Adding some random noise to historic market data can be a great way to test the stability of your trading strategy. A stable strategy will show similar profits with noisy and original data. If the noise has a great impact on your results, the strategy might be over fitted to the actual historic data.
Synthetic market data?
Generating completely synthetic market data to test algorithmic trading strategies is a dangerous endeavour. You easily lose significant properties like classic chart patterns or the trend properties of your market. Continue reading
Monte Carlo Simulation of strategy returns
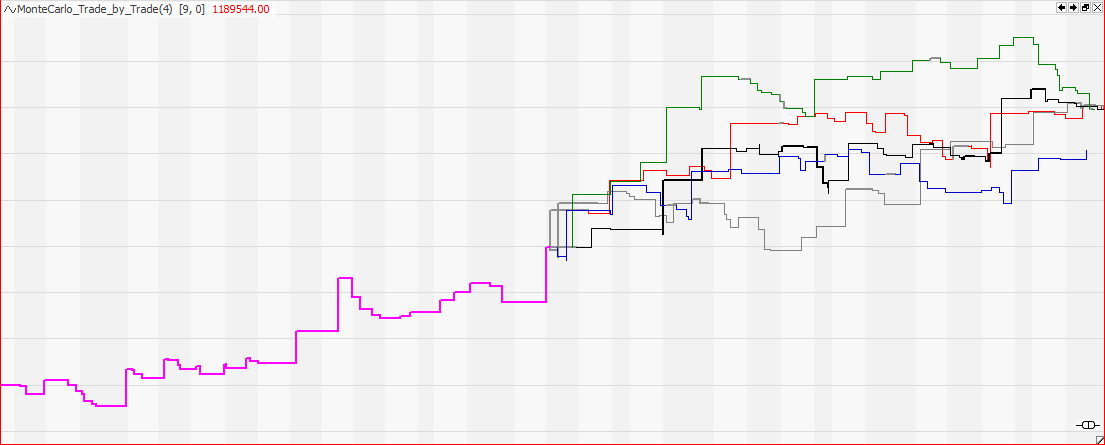
Monte Carlo Simulation uses the historic returns of your trading strategy to generate scenarios for future strategy returns. It provides a visual approach to volatility and can overcome limitations of other statistical methods.
Monte Carlo Simulation
Monte Carlo is the synonymous for a random process like the numbers picked by a roulette wheel. Continue reading
Overnight vs Daytime Performance & Volatility
Analysing the market performance of the day session vs. the overnight movement reveals some interesting facts.
Daytime vs. Overnight Performance
The chart below gives a visual impression on where the performance of the SPY ETF is coming from.
The grey line represents a simple buy and hold approach. The green line shows the performance if you would have held SPY only during daytime, closing out in the evening and re-opening the position in the morning. Continue reading
Bullish? Buy stock or sell put option?
So you are bullish on a specific stock, but you also have realised that timing is major problem? So what would be the best strategy to implement your bullish opinion but avoid the problems of any timing strategy?
Selling a put option might be the answer.
Bullish probability
For discussing this question let’s use the current Apple chart as an example. The question is, if you are bullish on apple, should you buy 100 Apple stocks right away or should you sell an at-the-money put option. To find the pros and cons of these two possibilities let’s have a look at some charts. Continue reading
An Algorithmic Stock Picking Portfolio
In this article I will discuss a simple algorithmic stock picking approach based on momentum and volatility. The goal will be to generate excess returns versus a capital weighted stock basket.
Alpha and Beta
Investing in assets with low volatility and high return is on a lot of peoples wish list. Portfolios which archive this goal will have a high Sharpe ratio and in the end get the investors money. By reverse engineering this criteria, one can find promising stocks to invest in and out perform a given capital weighted index.
Alpha and beta are measures to describe an assets performance relative to its index. Both are used in the CAPM – capital asset pricing model.
Alpha is a measure for an assets excess return compared to an index. Continue reading
The average move of a market
Markets have a high degree of randomness (and madness), but there are some things which hardly change over time. One is the width of an average market move before a counter-move can be observed. Continue reading
Market crash or market correction?
Over the last days and weeks some traders have been worried if the currently ongoing correction in the markets will evolve into a crash, or if it is just a normal correction.
Crash or correction
The main difference between a correction and a crash is the panic level. But it is not the absolute level of .VIX, the CBOE implied volatility meter. It is the difference between realized and implied volatility that defines a crash which defines real panic. Continue reading
Bollingerband: The search for volatility
Usually it makes no sense to fight against normal distribution. But there are setups which have got a high probability of unexpected behaviour. Volatility can be the key to future market movements.
Bollinger bands width percentile
Bollinger Bands are a great tool to describe market volatility. And my favourite tool to measure the width of Bollinger Bands is Bollinger percentile.
Like the IV percentile indicator my Bollinger percentile indicator is a probabilistic indicator. It gives the probability of Bollinger Bands having a narrower upper band – lower band range than currently given. Continue reading
Tradesignal Implied Volatility and IV Percentile Scanner
Implied volatility data is key in options trading. This article shows how to access free volatility data in the Tradesignal software suite.
Implied Volatility and IV Percentile
Thanks to https://www.optionstrategist.com/calculators/free-volatility-data implied volatility and IV percentile data is available. For free on a weekly basis. Using this data and the given code the data can be loaded into Tradesignal. This enables you to do your custom market scans, combining Tradesignal technical analysis and the implied volatility data from the optionstrategist website.
Free implied volatility data
The first step to use the optionstrategist data would be to safe it into a text file. Just copy and paste the data, no additional formatting is required. The free data on the website is updated every Continue reading
IV Percentile – when to sell volatility
Volatility trading: when to buy and when to sell volatility
You got to know when to hold ’em,
Know when to fold ’em,
Know when to walk away,
And know when to run.
(Kenny Rogers)
When to sell implied volatility
Volatility is a nicely reverting time series. If it is high chances are good that it will come down again. The only problem is to find out when volatility is high, and when it is low. Unfortunately there are no absolute levels, you can’t say that 50% implied volatility is high, as this specific stock might have an implied volatility of 80% most of the time. So you can only compare the current volatility level to historic levels and so define if volatility is currently high or low. Continue reading
Implied vs. Realized Volatility for NASDAQ100 stocks
(1) You shall only trade when the chances are on your side
Comparing implied and realised volatility
Selling volatility can be a profitable game, but only if you sold a higher volatility than the market realises later on. Comparing realised and current implied volatility gives you an idea if the chances are on your side.
We already had a look at realised volatility and what the fair price for a straddle might be. Have a look at the kvol–fair bet articles. These articles present a way to calculate the historically correct price for a straddle. Whenever you sell a straddle (to sell volatility), implied volatility should be higher than the fair bet price. Only then you will win on a statistical basis. Also have a look at the statistics of VIX, to get a clue when a downturn in volatility can be expected. Continue reading
Distribution of Returns
“Tomorrow never happens. It’s all the same fucking day, man. ” Janis Joplin
Distribution of Returns
Analysing history and hoping it will somehow repeat itself is the big hope of all quantitative traders. This article is about the distribution of market returns, but not about normal distribution, Gauss and standard deviation. This article is about the visualisation of market returns and what can be learned from it.
Probability distribution diagrams show the probability of a specific outcome. How likely is it that the market will be at a specific price sometimes in the future? How does a specific bullish or bearish indicator signal affect the future market behaviour on a statistical basis? An approaching visualisation of the statistical probabilities are the best way to understand market behaviour and find your chances in trading. Continue reading
Bet on Bollinger
Ever since John Bollinger introduced his Bollinger Bands in the early 1980s the bands have been a favourite indicator to all technical trades. This article is about the prediction capabilities of Bollinger bands.It researches the Bollinger breakout probability.
How good are the chances to be outside or inside of the bands in the future? How do these probabilities relate to the current position the market has got relative to today’s Bollinger band? What impact has overall volatility on these statistics? These questions will be answered below.
Bollinger Bands Breakout Probability
By definition of the indicator most of of the times the market will trade inside the Bollinger band. But this is only of minor interest to me. As a trader I am more interested on what will happen in a few days from now. Where will the future market be? Shall I bet on a breakout or sell a straddle?
So I did some tests on the forward prediction qualities of the Bollinger band indicator.
For all tests I used the 20 day, 2 standard deviations setting, which is the standard setting for most charting packages. Then I analysed the positioning of the market in 20 days form now to see if Bollinger bands can be of any help with these questions. Continue reading