Algorithmic trading adds noise to the markets we have known. So why not add some noise to your historic market data? This way you can check if your algorithmic trading strategies are fit for the future. Learn how to generate noisy data and how to test your strategies for stability in a noisy market.
Synthetic market data?
Generating synthetic market data to test algorithmic strategies is a dangerous endeavor. You easily lose significant properties of the data data, rendering it useless to test strategies based on exactly these properties of the historic data.
Think about chart patterns, candlestick pattern, trends vs. random drift or volatility behavior. If the data is produced by a random process these properties will not resemble the ones found in historic market data,
I am a believer in technical analysis and all it’s implications, so altering historic data is nearly a sacrilege to me. The goal of this article will be to present a way to randomize existing market data, instead of generating completely random data. This will preserve the original character, patterns and trends of the historic markets, just changing them slightly in a random way. This new, noisy data series can be used to do a realistic test to the the stability of your strategies.
Adding noise
There are several possible ways to add noise to existing data. You could add noise to the open/high/low/close of each individual bar. This would change individual short term market patterns.
You could add noise to the overall volatility. Or you could add a noisy drift to the overall trend of the data. With all this noise it is important not to differ too much from the original values. Candles with completely random open and close would not qualify for the test of a candlestick pattern based strategy. The same is true for too much volatility in a normally quiet market.
For not generating too random data I will use a normal distributed noise level, centered around zero. The level of noise is defined by it’s standard deviation. To make it reactive to the real market noise, a percentage of today’s real high-low range will be used to set the standard deviation of normal distributed random noise.
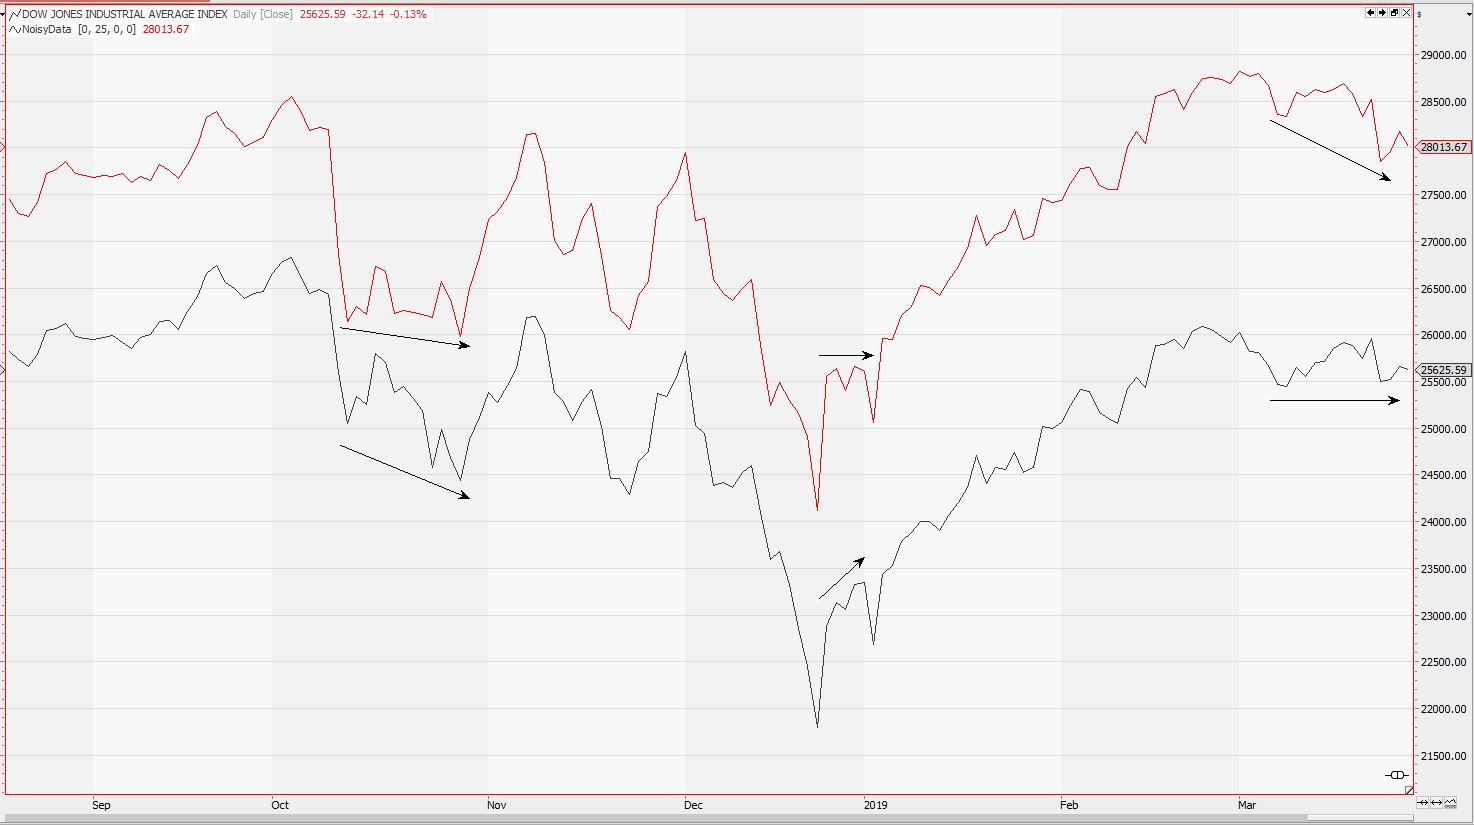
Noisy Data Candles
Adding noise to the daily data candles is a great way to test algorithmic strategies on their dependence on specific market characteristics.
If you add some noise to the open/high/low/close, you will not change the candle completely. But there will be slightly different prices and levels and candlestick patterns. They will trigger different trades and so give a new view on the stability of your trading strategy.
The chart above gives an example for such a test. Don’t say that Dow Jones could not have looked like on the chart above. But even if the differences are hard to spot, they got an influence on the shown trading strategy.
The data series on top is a slightly noisy copy of the original data series below. See how the same trading strategy generates different signals on these two sets of data. If the strategy is still profitable, this is a good sign for the stability of expected results.
Due to the normal distributed noise around the original open/high/low/close, the candles usually only differ slightly from the original ones. But nevertheless there will be different market highs and lows, and there will be different candlestick patterns. Just enough to fool the entry and exit logic of your strategy.
The standard deviation of the absolute variation (=noise) is a percentage of the original candles high-low range. This percentage is used as the standard deviation setting for the random noise around the original value. So large candles will get a bigger share of noise than small candles.
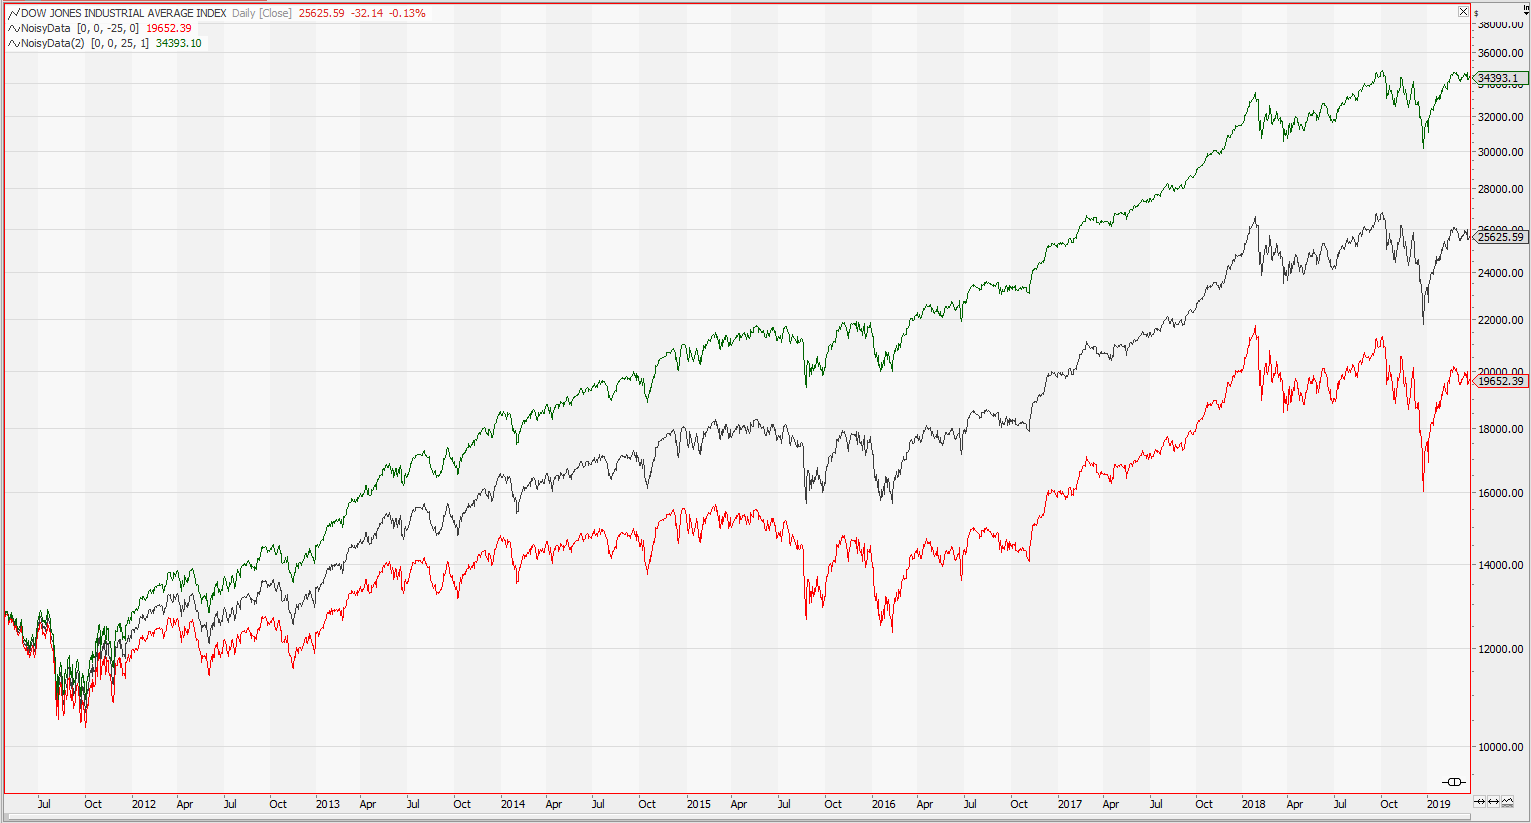
Adding noisy volatility
Beside changing the form of a candle, one can also change the volatility of the data. This is done by adding a random part to the overnight movement.

The chart above shows the differences of noisy data with a little extra overnight movement versus the original data. (which is the original?)
See the different chart patterns which emerge as the small random noise sums up. Although on overall the generated noisy data looks quite similar to the original data, you still got the same trends and long term patterns, it shows quite a different behavior in detail. Can your trading strategy handle these little differences in daily volatility, as they sum up to different patterns…?
Adding a trend
Beside changing the individual candles and the volatility of the data, one can also increase or decrease the overall trend of the data. This is done by adding a normal distributed random amount to each candle. (absolute data offset)
Testing algorithmic strategies
Testing algorithmic strategies for their resilience on market data noise can deliver valuable insights when comparing different strategies of similar type. Monte Carlo simulation just changed the order of the historic trades to find out more about the expected volatility of returns. This random data analysis will reveal the influence of patterns, volatility and market trends on your strategy.
The chart below gives the results of such a test. It uses 100 different random time series, and alters them by different settings of added noise for volatility and general data drift (trend)
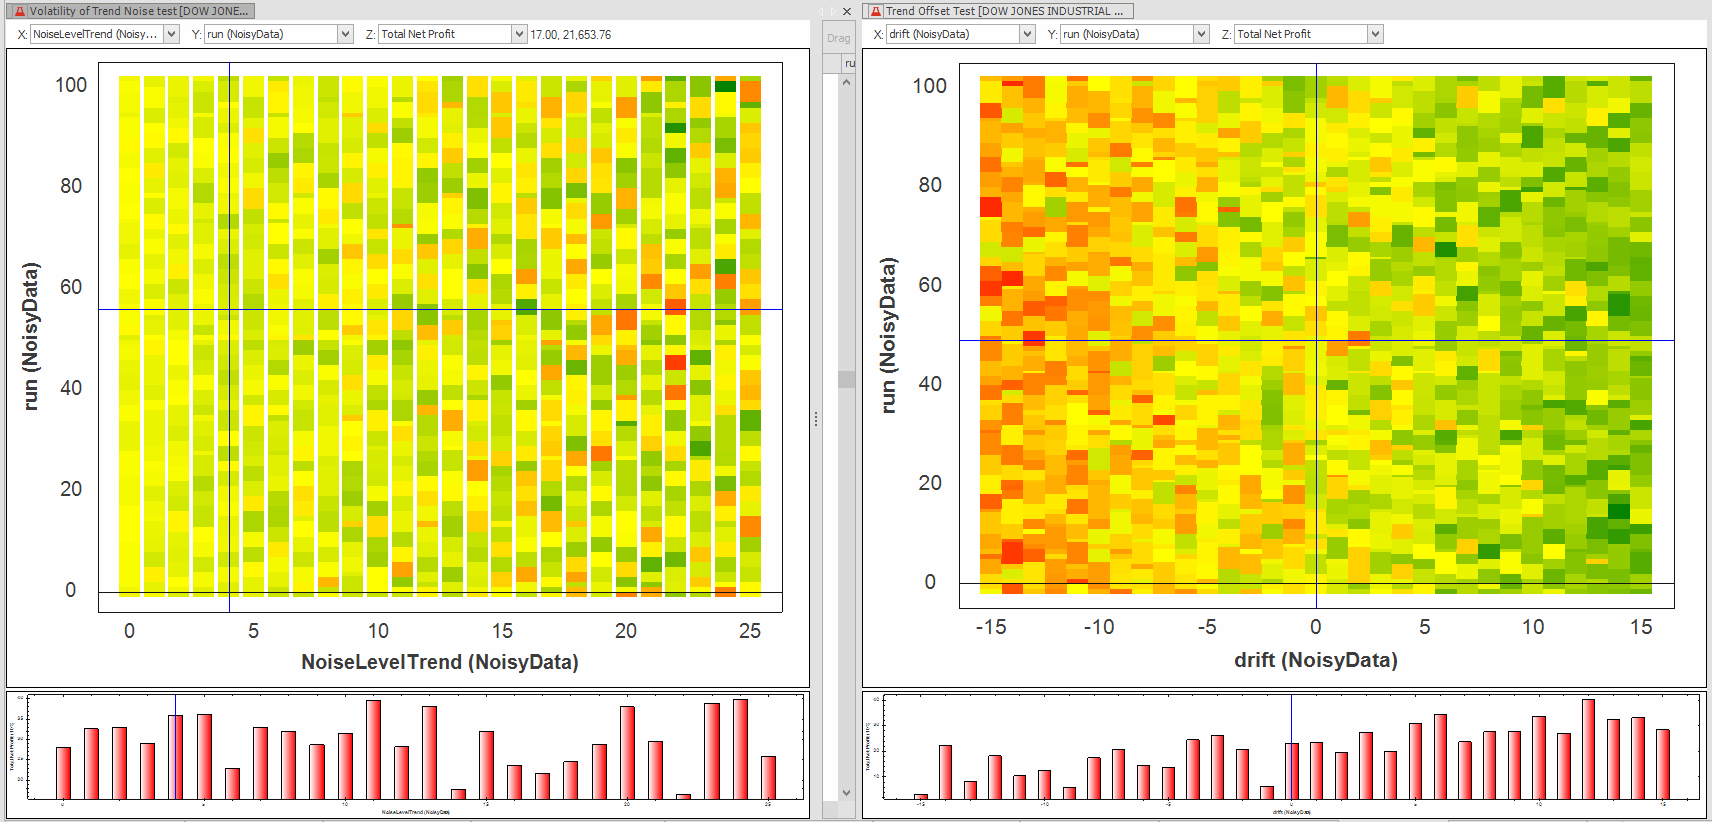
The chart on the left shows the influence of volatility noise. Therefore a normal distributed percentage of the daily high-low range has been added to the overnight movement. As you can see there is a specific level of 5, when the strategy results start to get wider distributed.
In the chart above the color represents the profit of the strategy. The more diverse it gets, the more diverse the returns of possible strategy returns are. If you compare this to a different strategy, you see which one is more sensible to slight changes in market behavior.
The chart on the right shows the influence of a general drift or trend to the outcomes of the strategy.
As you can see the strategy does not like environments with a weaker bullish trend than we have seen in history. Although a long-only strategy has been tested on Dow Jones data, a more intelligent trend filter might prevent negative results with possibly less bullish markets.
Using synthetic market data which still preserves the original attributes of the original data is a valuable tool in testing strategies for their stability in different market environments. The shown framework allows to change the data in three different ways and can generate an endless number of random time series to test your strategies for weak points and possible future behavior.
Tradesignal Code and Usage
The indicator code to generate the shown data series consists of 2 parts. First there is a function which returns a normal distributed random number with the given standard deviation.
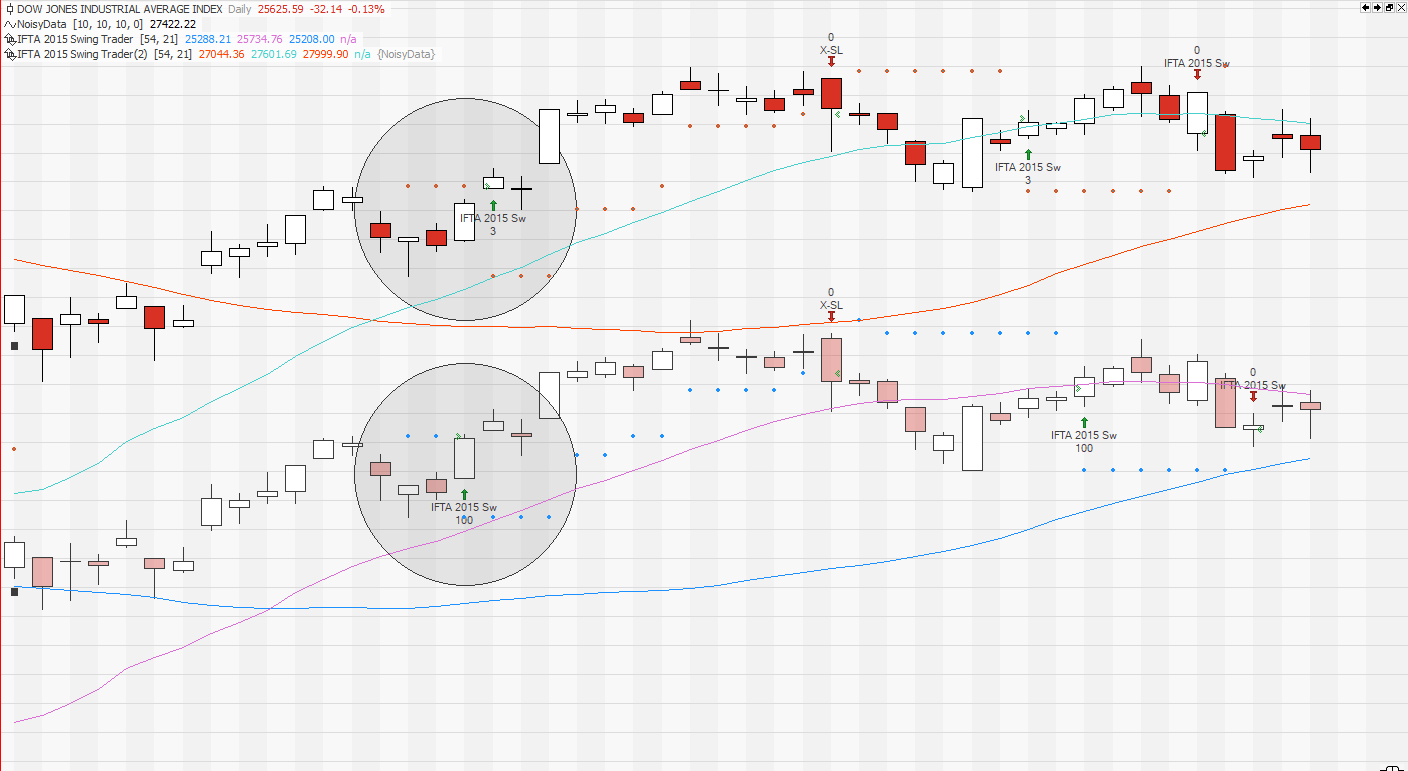
The second part is the indicator itself. Please add it on a chart to see the newly generated time series. To generate a new one use the run setting. This setting can also be used to run a stability test in the Tradesignal optimizer as shown on the chart above.
The code is free to use for non commercial usage under the GNU terms. Please acknowledge this by typing privateuse as password to the code page