A self optimising moving average

Different markets and different timeframes will need different moving average periods. This article will show a way to construct a self optimising moving average, one which automatically adjusts its period to the charted market and timeframe.

Reading a simple moving average

I would like to start this new indicator with some thoughts about how to define how “good” a moving average is. Usually my (simplified) standard interpretation of a moving average is, that when it rises and the market trades above the average, I am in bullish mode and would expect the market to rise over the next  bars. This very simple interpretation of a moving average can be quantified, meaning that I can calculate a measure to judge if my assumption is any good. To do so, I just count the number of bars which have been rising and falling while (initial condition) the market has been above the average and the average has been rising. This will give me a number, and let’s say on 52% of the bars in history when the initial condition was met, the market rose on the day after. As the chance is better than 50%, I would conclude that the analysed average is a useful one.

Self optimising moving average

Instead of just analysing one specific moving average length one could calculate the metrics for all moving averages. The sample implementation (code at the end of the article) will calculate all moving averages within a given parameter range (eg. 5 bars to 200 bars), calculate the winning percentage (rising bars) on the next bar, and then pick the best performing period length.

self optimising moving average

self optimising moving average

The moving average on the chart above constantly changes its period to the period, which would have given the best indication in history. As the original criteria has been to maximise the percentage of up-moving bars when the market is above the average and the average is rising, the shown moving average will always be the one which will give you the highest probability of a rising bar (next bar) if the average is rising and the market is trading above it. These periods are shown in green. Otherwise, if the criteria is not met or the winning percentage is below 50 (=no average has a better than 50:50 prediction capability), the indicator is colour coded red.

Advantage of the perfect average

Beside plotting the best moving average, one could also plot the statistics of the best moving average. This would be the percentage of winning bars when the original criteria is met.

best average statistics

best average statistics

The chart above shows a comparison of 3 different timeframes. A daily, hourly and 5 minute chart. The indicator below shows the edge the best moving average would give when trying to predict rising bars. A level of 5 would mean that you got a 55% chance for a rising bar when selecting the best performing period for your moving average and the average is rising and the market trades above it.

Using the self adjusting average this way, you can easily see in which timeframes or markets a moving average prediction model would be useful. On the chart above you obviously do not want to use this simple indicator interpretation on a 5 minutes chart. If the indicator is colour coded in red, either the market is not trading above the best average, the best average is not rising, or it would give no edge when trying to predict the next bars move.

Stability of results

As the indicator is based on a statistic over a given period of time, we have to think about stability and outliners. To remove outliner results, the statistics are smoothed. Instead of taking the winning percentage for a given average length, also the 2 results to the left and right are taken into account. The indicator can also plot these smoothed results, so you can see the edge the average prediction would offer with different periods.

On the chart below, the magenta histogram on the right shows the historic edge (smoothed) over the tested periods for the averages. From length 7 to length 148 all results would have been positive (a better than 50:50 chance for a rising bar), the best result was obtained with a period of 31. Observe this with different lengths of history, and you will get a good guess if your market is the right one for this kind of analysis. If the edge is not above 50% with a lot of periods, then this prediction will hardly be useful.

best period average complete

best period average complete

Link to indicator source code

Find the indicator code over here. The code is written in Equilla, the scripting language of the Tradesignal software.

The indicator uses all available data on the chart to calculate the statistics. You can set the range of periods you want to analyse. If you would like to backtest the indicator (go long when green) then just add the line below at the end of the code (used as strategy)

best period average backtest code

best period average backtest code

Continue reading

Z-Score Factor Portfolio Weighting

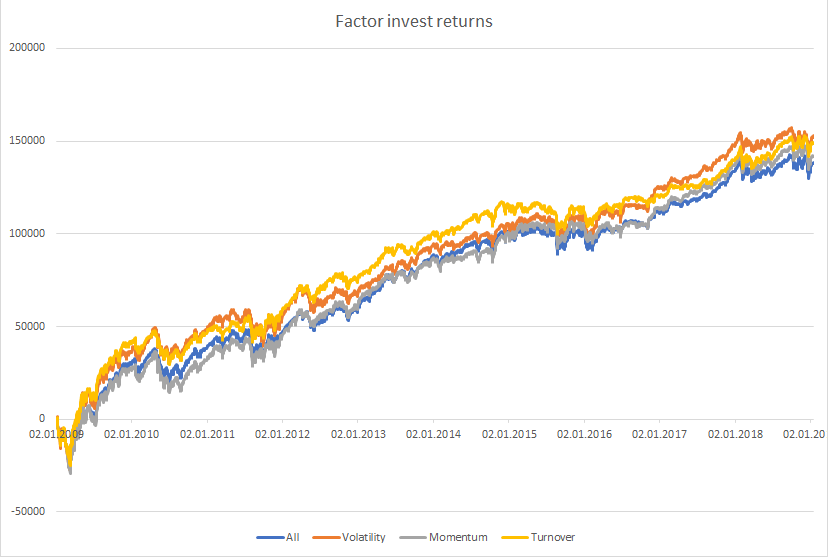
Technical Indicators can be used for timing and weighting strategies. Using momentum as an example, you could go long if the momentum turns positive, or you could dimension the weight of your position depending on the level of momentum. Applied on a portfolio of assets, this would be called factor investing. This article will show you a way to weight your portfolio using factors. Continue reading

Profit from large daily moves

Whenever the market shows an exceptional day ranges it is time to take bite. See how you can profit from large daily market moves.

Open-Close Range

When looking at any chart, you will surely notice that the large candles tend to close near the high or low. This is due to herding. Once the market is moving significantly, everyone hops on and the large move becomes even larger. This is true for daily, weekly and intraday candles.

The chart shows an indicator which plots the daily move. Every opening is set to zero and the absolute move of the day is drawn. Around these normalised candles a long term 2 standard deviation volatility band is drawn.  Right now the 2 standard deviation volatility for SPX is about +/- 46 points.

Take a bite before the market closes

As you can see this +/-46 point barrier above/below the opening of the day is a wonderful entry point. If you enter long 46 points above the opening and go short 46 points below the opening nearly all entries would have lead to a profitable trade. To get an even higher probability of success you can volume as a confirmation. Large moves must also show high volume. The exit is done at the end of the session. This analysis does not give any indication for the next days move. So be fast, take your bite and go home with a small profit and no overnight position.

No free lunch

On the chart it looks easy, but be careful. As an example the last bar shown on the chart first crossed the band to the downside, reversed and crossed above the upper band. So you will need to use a trailing stop to lock in profits and avoid to take the full -46 to +46 points trade as a loss!


Python Regression Analysis: Drivers of German Power Prices

German Power prices can be explained by supply and demand, but also by causal correlations to underlying energy future prices. A properly weighted basket of gas, coal and emissions should therefore be able to resemble the moves of the power price.  This article will introduce multivariate regression analysis to calculate the influence of the underlying markets on a given benchmark. It is an example of  a machine learning algorithm used in analysis and trading.

Multivariate regression analysis

Continue reading

VIX Futures spread trading

VIX futures are usually in contango, meaning that the next month future is quoting at a higher price than the current month VIX future. But this spread in not constant, and at the end of the expiry cycle an interesting VIX future spread trading idea comes to my mind…

End of cycle VIX futures spread trading

Having a look at the chart below you hopefully see the spread trading idea by yourself: Continue reading

How to detect unwanted curve fitting during backtest

Whenever you develop an algorithmic trading strategy, unwanted curve fitting is one of the most dangerous hazards. It will lead to substantial losses in real time trading. This article will show you some ways to detect if the performance of your algorithmic trading strategy is based on curve fitting.

Curve fitting – what is it?

Every algorithmic trading strategy will have some parameters. There is no way around it. You will have to decide what length your indicators have, you will have to specify a specific amount for your stop loss or profit target. Beside the actual rules of your strategy the chosen parameters will usually significantly influence the back-test performance of your strategy. And with any parameter you add the danger of curve fitting rises significantly. Continue reading

The Edge of an Entry Signal

When developing a new trading strategy you are usually confronted with multiple tasks: Design the entry, design the exit and design position sizing and overall risk control. This article is about how you can test the edge of your entry signal before thinking about your exit strategy. The results of these tests will guide you to the perfect exit for the tested entry signal (entry-exit combination)

Quality of an Entry Signal

When you develop a new idea for an entry signal there are two things you would like to see after the entry: no risk and fast profits. This would be the perfect entry with the highest possible edge. In reality the market response to your entry will be risk and chance. With a good entry the upside would outnumber the downside. Continue reading

The Probability of Normality

When selling implied volatility you want the market to stay within the  expected range. But what is the historic probability that markets behave as expected? And what other analysis could be done to enhance your chances and find the periods when it is wise to sell an at the money straddle? This article will try to give some answers to this question.

The normal distribution cone

Continue reading

The Edge of Technical Indicators

Classical technical indicators like RSI and Stochastic are commonly used to build algorithmic trading strategies.  But do these indicators really give you an edge in your market? Are they able to define the times when you want to be invested? This article will show you a way to quantify and compare the edge of technical indicators. Knowing the edge of the indicator makes it an easy task to select the right indicator for your market.

The edge of an indicator

Any technical indicator, let it be RSI, moving averages or jobless claims, has got a primary goal. It should signal if it is a wise idea to be invested or not. If this indicator signal has any value, on the next day the market should have a higher return than it has on average. Otherwise  the usage of no indicator and a buy and hold investing approach would be the best solution.

The edge of an indicator in investing consists of two legs.

  1. the quality of the signal
  2. the number of occurrences

Continue reading

Daily Extremes – Significance of time

Analyzing at which time daily market extremes are established shows the significance of the first and last hours of market action. See how different markets show different behavior and see what can be learned from this analysis.

Probability of Extremes

A day of trading usually starts with a lot of fantasies for the future, then we try to survive the day and end it with a lot of hope for tomorrow. This psychological pattern can also be shown when analyzing intraday market data. A high level of fantasies usually leads to a strong market movement, and thus market extremes can often be seen near the beginning or the end of the trading session. Continue reading

S&P500 – when to be invested

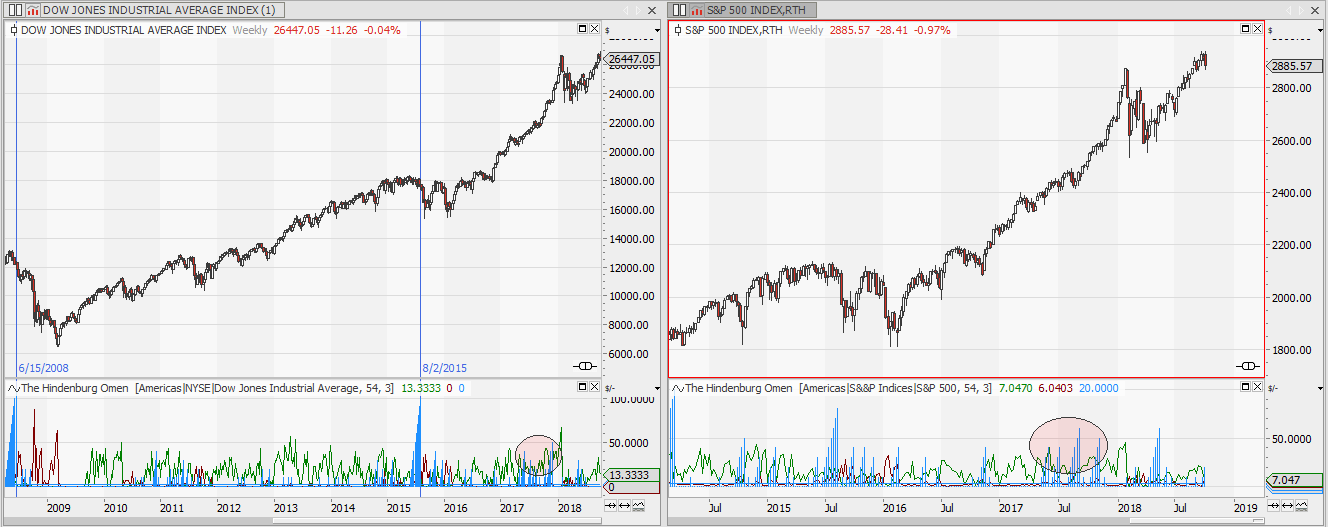
The stock market shows some astonishingly stable date based patterns. Using a performance heat map of the S&P500 index, these patterns are easily found.

Date based performance

The chart below shows the profit factor of a long only strategy investing in the S&P500. Green is good, red is bad. The strategy is strictly date based. It always buys and sells on specific days of the month. Continue reading

Noisy Data strategy testing

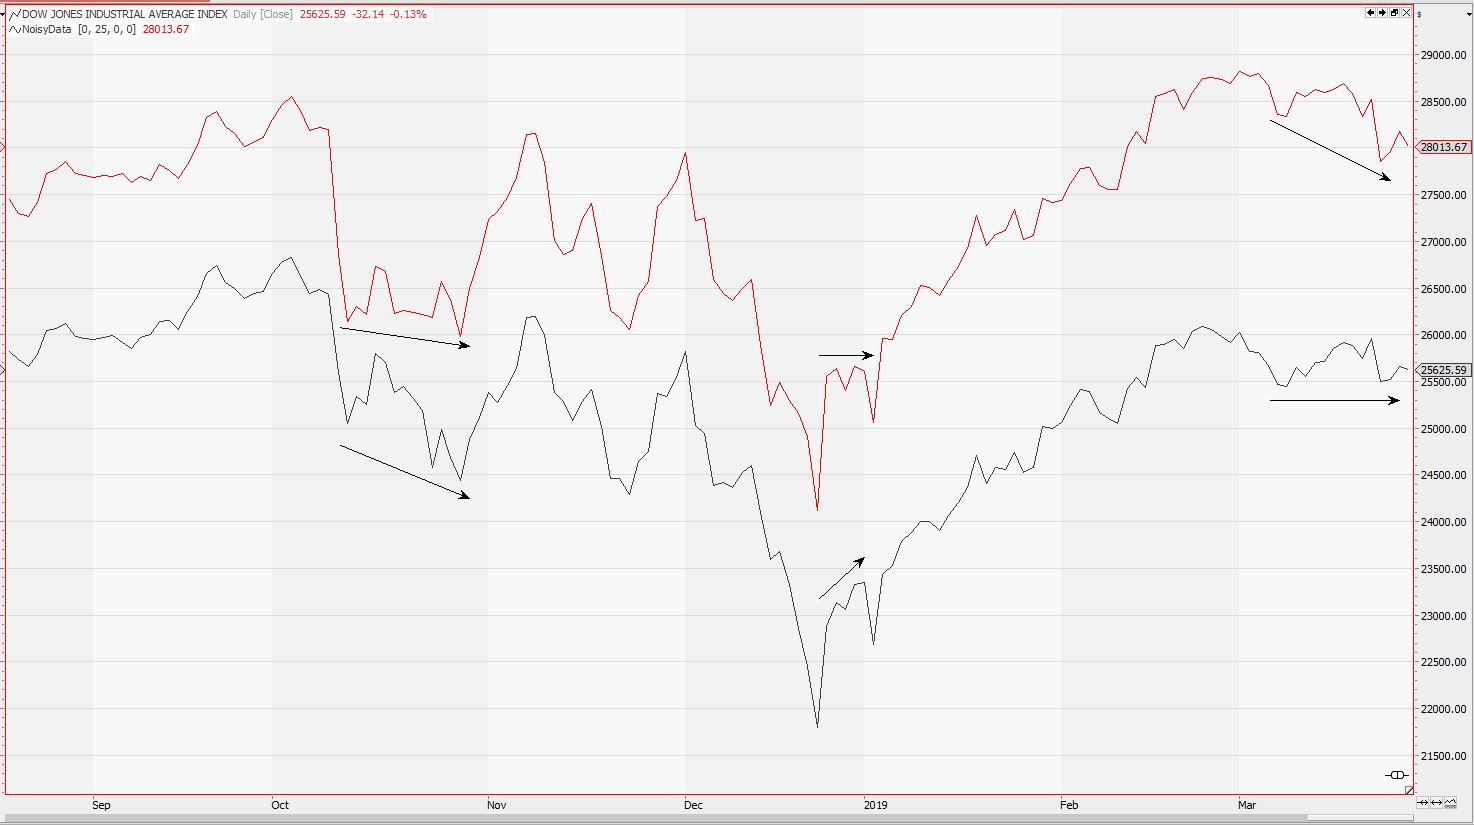
Adding some random noise to historic market data can be a great way to test the stability of your trading strategy. A stable strategy will show similar profits with noisy and original data. If the noise has a great impact on your results, the strategy might be over fitted to the actual historic data.

Synthetic market data?

Generating completely synthetic market data to test algorithmic trading strategies is a dangerous endeavour.  You easily lose significant properties like classic chart patterns or the trend properties of your market. Continue reading

Monte Carlo Simulation of strategy returns

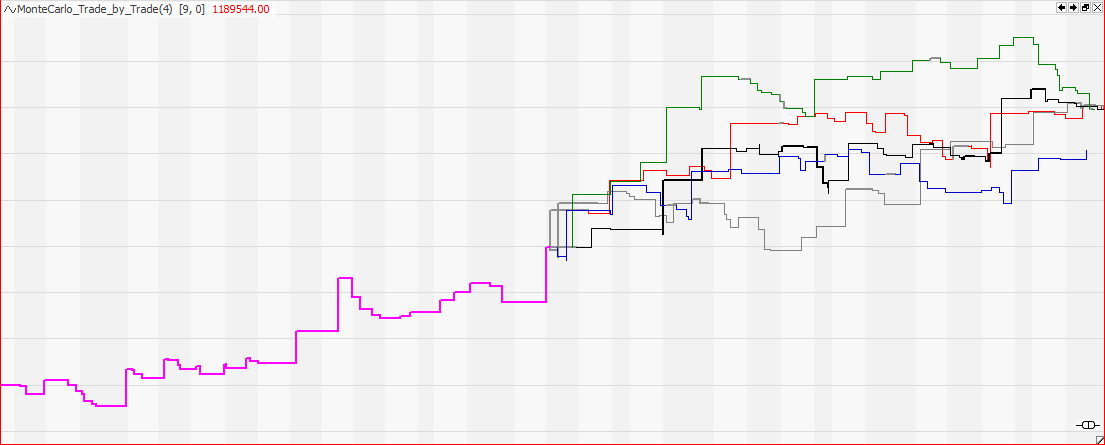
Monte Carlo Simulation uses the historic returns of your trading strategy to generate scenarios for future strategy returns. It provides a visual approach to volatility and can overcome limitations of other statistical methods.

Monte Carlo Simulation

Monte Carlo is the synonymous for a random process like the numbers picked by a roulette wheel. Continue reading

Dollar Cost Averaging Investment Strategy – success based on luck?

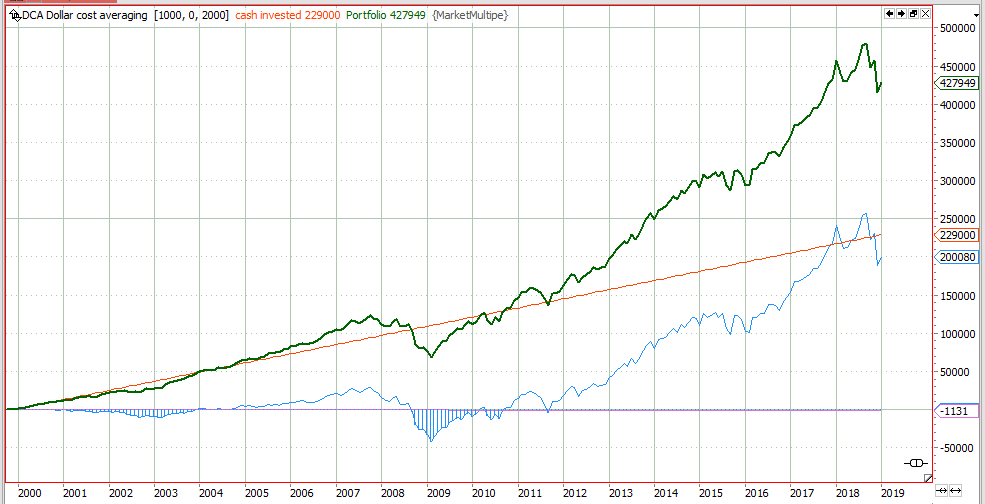
This article is about the dollar cost averaging investment strategy and the influence of luck in it.

The Dollar Cost Averaging Investment Strategy

To invest parts of your income into financial markets has been a profitable approach, especially in times when bond yields are low. One approach to do so is the dollar cost averaging investment strategy. Continue reading

Bullish? Buy stock or sell put option?

So you are bullish on a specific stock, but you also have realised that timing is major problem? So what would be the best strategy to implement your bullish opinion but avoid the problems of any timing strategy?

Selling a put option might be the answer.

Bullish probability

For discussing this question let’s use the current Apple chart as an example. The question is, if you are bullish on apple, should you buy 100 Apple stocks right away or should you sell an at-the-money put option. To find the pros and cons of these two possibilities let’s have a look at some charts. Continue reading