When developing a new trading strategy you are usually confronted with multiple tasks: Design the entry, design the exit and design position sizing and overall risk control. This article is about how you can test the edge of your entry signal before thinking about your exit strategy. The results of these tests will guide you… Continue reading The Edge of an Entry Signal
Tag: Exit
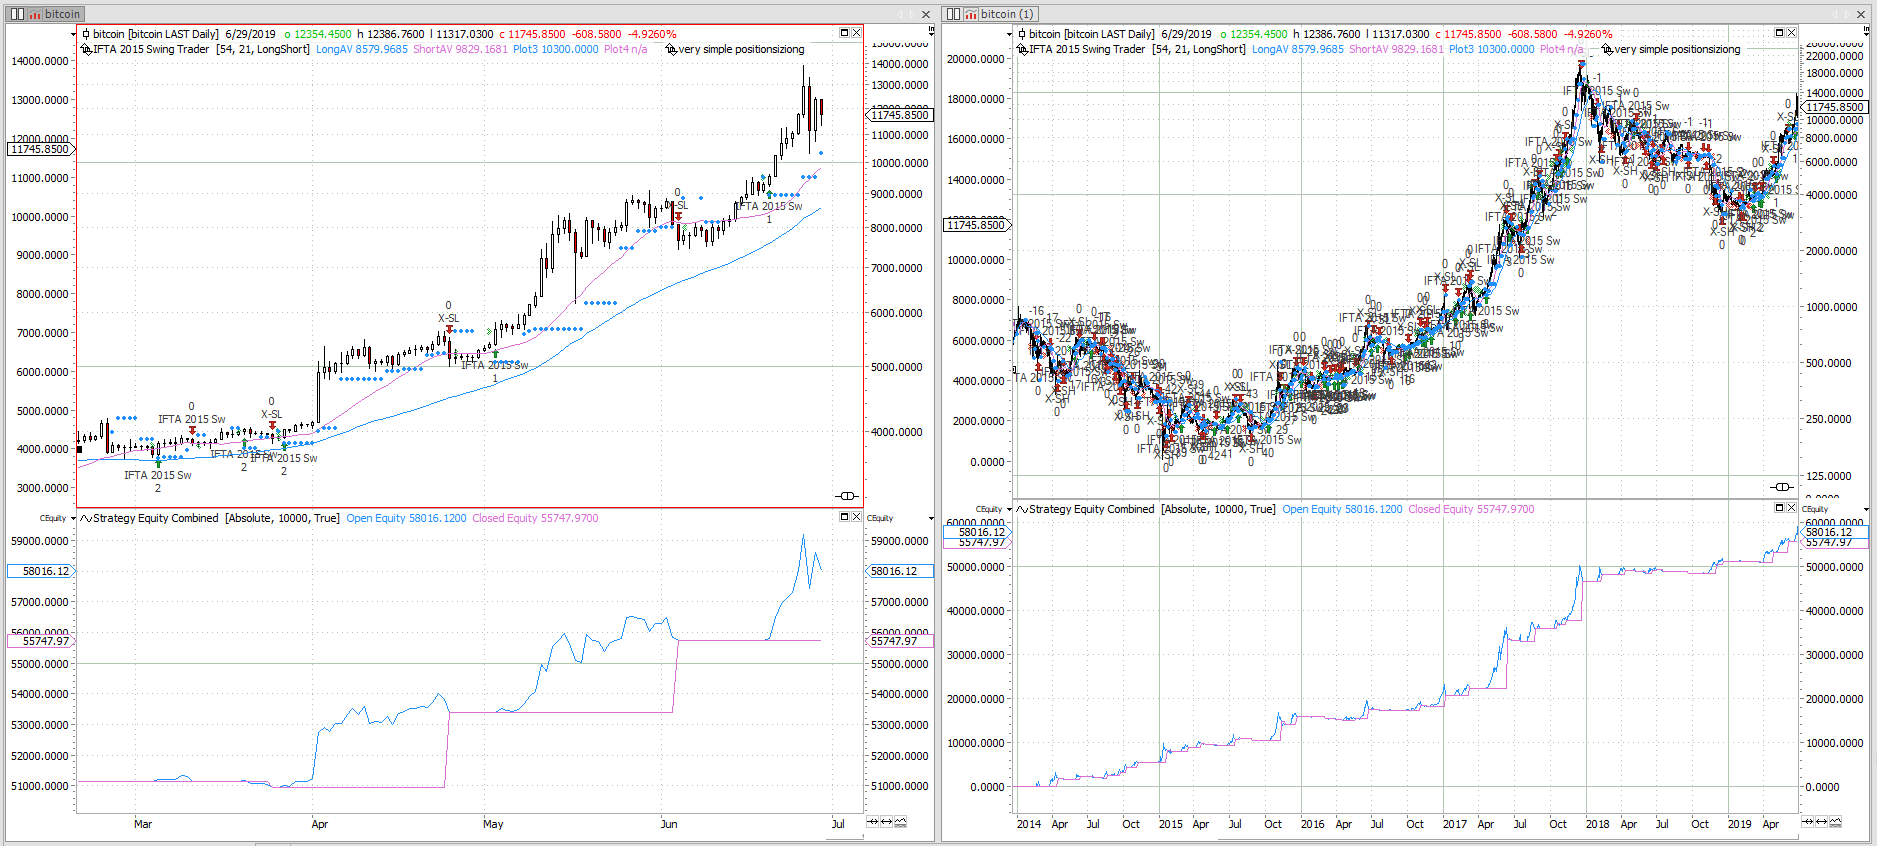
Bitcoin Swing Trading
A simple bitcoin Swing Trading strategy originally published in 2015. See the out of sample performance and how it is done.
S&P500 – when to be invested
The stock market shows some astonishingly stable date based patterns. Using a performance heat map of the S&P500 index, these patterns are easily found. Date based performance The chart below shows the profit factor of a long only strategy investing in the S&P500. Green is good, red is bad. The strategy is strictly date based.… Continue reading S&P500 – when to be invested
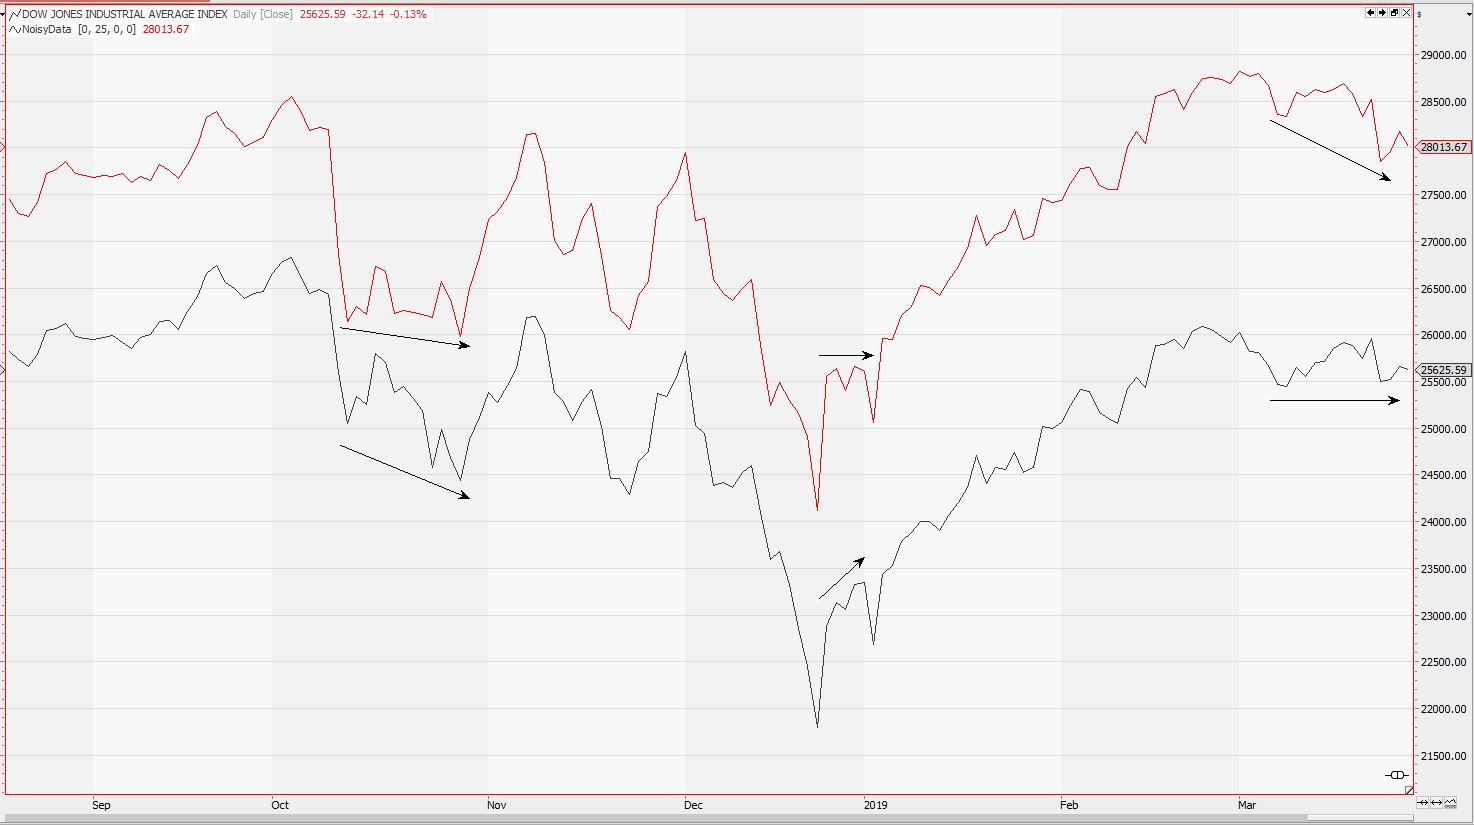
Noisy Data strategy testing
Algorithmic trading adds noise to the market we have known. So why not add some noise to your historic market data. This way you can check if your algorithmic trading strategies are fit for the future. Learn how to generate noisy data and how to test your strategies for stability in a noisy market.
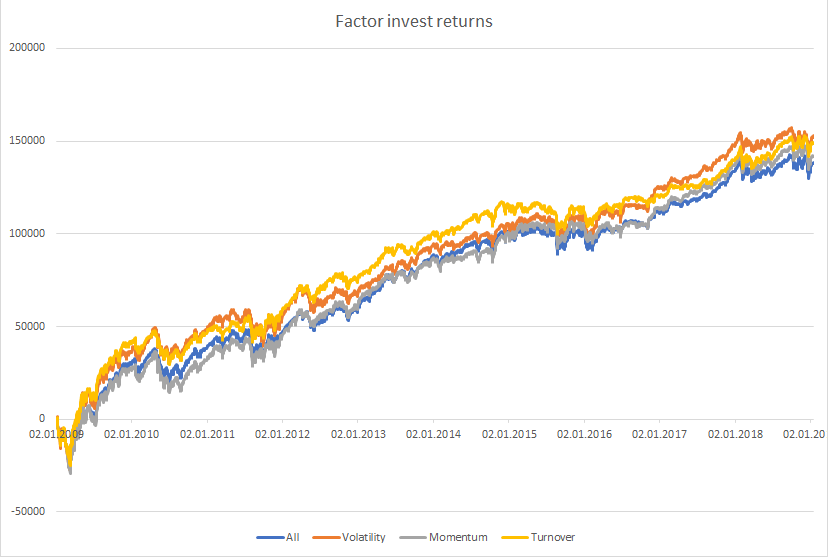
Factor investing in portfolio management
Factor investing has been around in portfolio management for some years. Based on algorithmic rules it became the big thing in trading and the ETF industry. But is there still some money to be made? Is small beta still smart or just beta? This article will give you a Tradesignal framework to test the factor… Continue reading Factor investing in portfolio management
Technical vs. Quantitative Analysis
Technical and quantitative analysis are two different types of market analysis. Both are based on price and historic market behaviour. Which is the one you should trust, which you should avoid?
An Algorithmic Stock Picking Portfolio
A volatility and return based stock picking algorithm. Portfolio construction, picking criteria and the ideas behind this approach. Excess returns of your portfolio against an equally weighted index portfolio.
Statistics of VIX
This article is about the statistics of VIX. What determines if it is better to sell or to buy volatility. Some simple statistics can provide the answer and also show the dangers of this kind of volatility trade.
Machine learning: kNN algorithm explained
Can inspiration be replaced by brute force? This article shows how to program and possibly use a simple kNN algorithm to trade Brent. A two dimensional data set will be used. RSI will determine if tomorrows market will move up or down.
NASDAQ 100 long term candlestick scanner
A short update on the long term Candlestick Scanner. The Candlestick Scanner scans the Nasdaq 100 stocks for long term bullish or bearish reversal patterns. The basic idea is to search for hammer and hanging man candlestick patterns. Usually these patterns work nicely on daily charts. My Candlestick Scanner searches for these two patterns on… Continue reading NASDAQ 100 long term candlestick scanner
Position sizing – the easy way to great performance
Working on your position sizing algorithm is an easy way to pimp an existing trading strategy. Today we have a look at an energy trading strategy and how the position sizing can influence the performance of the strategy. The screenshot shows you the returns of the same trading strategy, trading the same markets, the same… Continue reading Position sizing – the easy way to great performance
Opening Range Breakout
Opening Range Breakout Strategie von Perry Kaufmann aus “Technical Analysis of Stocks & Commodities”
Selbstlernende Handelssysteme
Ein jeder kennt die klassischen Indikatoren wie RSI oder Stochastic. Und ein jeder kennt die dazugehörigen Handelsanweisungen: Long, wenn überverkauft, Short wenn überkauft. Und zumindest im Lehrbuch funktioniert das auch. Aber wie sieht das ganze am realen Chart aus? Würden Sie dem Lehrbuch vertrauen und Ihren Kunden auch einen baldigen Kauf empfehlen wenn der RSI unter… Continue reading Selbstlernende Handelssysteme
Reality vs. Robert W. Colby, CMT
Ein Out of Sample test eines Handelssystems von Robert Colby. War es curve fitting, oder sind die Märkte effizient?


