The seemingly unlimited printing of money by central banks has driven markets to unimagined heights. But what does market performance really look like after adjusting for M1 money supply and inflation CPI?
Speculation
The coastline paradox and the fractal dimension of markets
Coastlines are fractal curves. When you zoom in, you will see similar shaped curves on every scale. The same is true for market data. On a naked chart you can hardly tell if it is a daily or hourly chart. This article will explore this feature of crinkly curves and show how much markets and coastlines have in common.
The coastline paradox
When trying to measure the length of the British coastline you will quickly notice, that the length measured depends on the length of the ruler you use. The shorter the ruler, the longer the measured length of the coastline.
When measuring a straight line, the length of the ruler has no influence. You can measure 1 meter with a 1cm ruler applied 100 times or with a 50cm ruler applied 2 times. Both methods will give you the same result. Not so when measuring a crinkly line like a coast.
British coastline length paradox (c) wikipedia
In 1967 Benoit Mandelbrot wrote a famous article in Science magazine about this problem. This was the birth of fractal geometry. The basic assumption was, that if a curve is self similar, this self similarity can be described by the fractal dimension of a curve. Self similarity means, that if you zoom into a curve, it looks similar on all zoom levels.
Coastline paradox in financial markets
Statistics of Point&Figure Charts
Point&Figure charts have been around for more than a 100 years and they are still quite popular, especially with commodities and forex traders. This article will do some statistical analysis of the most basic Point&Figure signal.
Point&Figure Charts – price movements only
Free webinar series on algorithmic trading
I am happy to announce that I will be hosting a free webinar series on quantitative analysis and algorithmic trading. Dates and times for the first shows can be found over here: Tradesignal Webinar Series
Date and Time based patterns
A Neural Network based trading strategy
I always dreamed about the machine which tells me to enter long right before the market starts to go up. Might a neural network be this machine? Using Tradesignal and the free Python Neural Net library Pyrenn it is easy to find out…
Part one: Classification of data
Overnight Risk Premium in Equity and Commodity Markets
Over the last 20 years equity markets and ETFs did a significant part of their total performance over night. This article will examine the relationship of in-session moves vs. the out-of-session moves of ETFs and commodities.
The overnight risk premium
The magic of implied volatility
VIX and implied volatility in general is a measure of the expected market move. If VIX is trading at 50, the option market expects that the market will stay within 50% up or down within the next year. Continue reading
VIX Futures spread trading
VIX futures are usually in contango, meaning that the next month future is quoting at a higher price than the current month VIX future. But this spread in not constant, and at the end of the expiry cycle an interesting VIX future spread trading idea comes to my mind…
End of cycle VIX futures spread trading
Having a look at the chart below you hopefully see the spread trading idea by yourself: Continue reading
How to detect unwanted curve fitting during backtest
Whenever you develop an algorithmic trading strategy, unwanted curve fitting is one of the most dangerous hazards. It will lead to substantial losses in real time trading. This article will show you some ways to detect if the performance of your algorithmic trading strategy is based on curve fitting.
Curve fitting – what is it?
Every algorithmic trading strategy will have some parameters. There is no way around it. You will have to decide what length your indicators have, you will have to specify a specific amount for your stop loss or profit target. Beside the actual rules of your strategy the chosen parameters will usually significantly influence the back-test performance of your strategy. And with any parameter you add the danger of curve fitting rises significantly. Continue reading
The Probability of Normality
When selling implied volatility you want the market to stay within the expected range. But what is the historic probability that markets behave as expected? And what other analysis could be done to enhance your chances and find the periods when it is wise to sell an at the money straddle? This article will try to give some answers to this question.
The normal distribution cone
Daily Extremes – Significance of time
Analyzing at which time daily market extremes are established shows the significance of the first and last hours of market action. See how different markets show different behavior and see what can be learned from this analysis.
Probability of Extremes
A day of trading usually starts with a lot of fantasies for the future, then we try to survive the day and end it with a lot of hope for tomorrow. This psychological pattern can also be shown when analyzing intraday market data. A high level of fantasies usually leads to a strong market movement, and thus market extremes can often be seen near the beginning or the end of the trading session. Continue reading
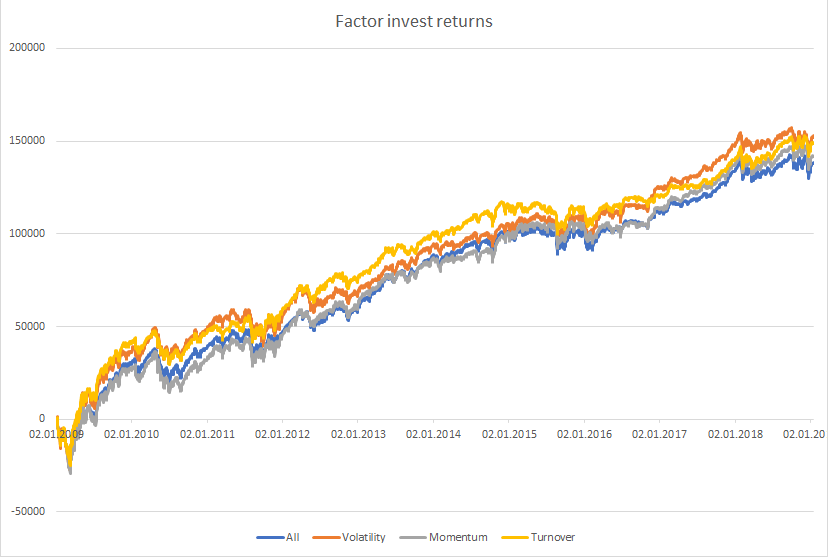
Protected: Factor investing in portfolio management
Enter your password to view comments.
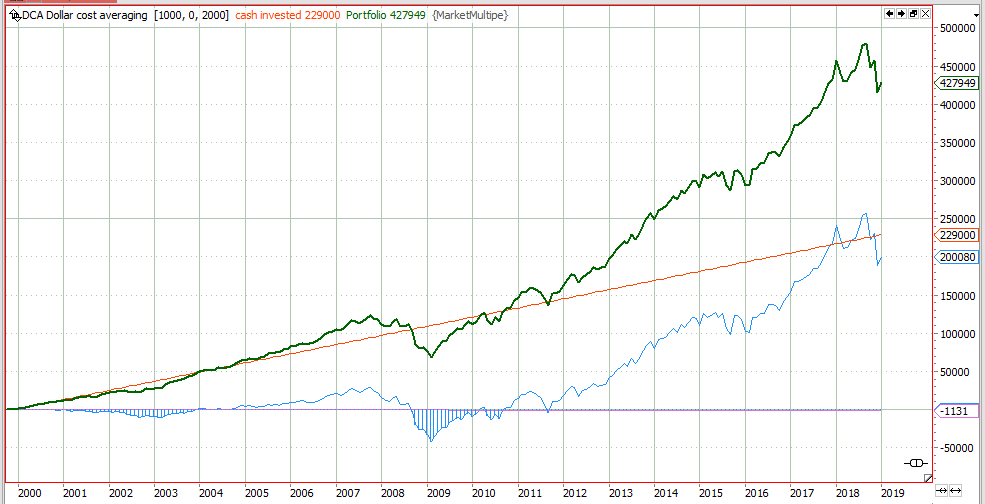
Dollar Cost Averaging Investment Strategy – success based on luck?
This article is about the dollar cost averaging investment strategy and the influence of luck in it.
The Dollar Cost Averaging Investment Strategy
To invest parts of your income into financial markets has been a profitable approach, especially in times when bond yields are low. One approach to do so is the dollar cost averaging investment strategy. Continue reading
Historic Bear Markets & Crashes (business as usual)
Since S&P500 has lost 20% from its top in 2018 and everybody is talking about bear markets. See what has happened in history.
We all have been spoiled by artificially low volatility over the last years.
Now people blame the gone-wild president or algorithmic trading for the market correction, but let us have a look into history to see how common market corrections have been over the last century. Continue reading
Pears Global Real Estate – calling the devil by its name
Gentrification has got a new victim; After 33 years my favourite pub in Berlin, Syndikat, has been kicked out by unethical investment company Pears Global Real Estate, run by the family patriarch Mark Pears. Continue reading
Bullish? Buy stock or sell put option?
So you are bullish on a specific stock, but you also have realised that timing is major problem? So what would be the best strategy to implement your bullish opinion but avoid the problems of any timing strategy?
Selling a put option might be the answer.
Bullish probability
For discussing this question let’s use the current Apple chart as an example. The question is, if you are bullish on apple, should you buy 100 Apple stocks right away or should you sell an at-the-money put option. To find the pros and cons of these two possibilities let’s have a look at some charts. Continue reading
The average move of a market
Markets have a high degree of randomness (and madness), but there are some things which hardly change over time. One is the width of an average market move before a counter-move can be observed. Continue reading
Market crash or market correction?
Over the last days and weeks some traders have been worried if the currently ongoing correction in the markets will evolve into a crash, or if it is just a normal correction.
Crash or correction
The main difference between a correction and a crash is the panic level. But it is not the absolute level of .VIX, the CBOE implied volatility meter. It is the difference between realized and implied volatility that defines a crash which defines real panic. Continue reading
IV Percentile – when to sell volatility
Volatility trading: when to buy and when to sell volatility
You got to know when to hold ’em,
Know when to fold ’em,
Know when to walk away,
And know when to run.
(Kenny Rogers)
When to sell implied volatility
Volatility is a nicely reverting time series. If it is high chances are good that it will come down again. The only problem is to find out when volatility is high, and when it is low. Unfortunately there are no absolute levels, you can’t say that 50% implied volatility is high, as this specific stock might have an implied volatility of 80% most of the time. So you can only compare the current volatility level to historic levels and so define if volatility is currently high or low. Continue reading
Bet on Bollinger
Ever since John Bollinger introduced his Bollinger Bands in the early 1980s the bands have been a favourite indicator to all technical trades. This article is about the prediction capabilities of Bollinger bands.It researches the Bollinger breakout probability.
How good are the chances to be outside or inside of the bands in the future? How do these probabilities relate to the current position the market has got relative to today’s Bollinger band? What impact has overall volatility on these statistics? These questions will be answered below.
Bollinger Bands Breakout Probability
By definition of the indicator most of of the times the market will trade inside the Bollinger band. But this is only of minor interest to me. As a trader I am more interested on what will happen in a few days from now. Where will the future market be? Shall I bet on a breakout or sell a straddle?
So I did some tests on the forward prediction qualities of the Bollinger band indicator.
For all tests I used the 20 day, 2 standard deviations setting, which is the standard setting for most charting packages. Then I analysed the positioning of the market in 20 days form now to see if Bollinger bands can be of any help with these questions. Continue reading