In this article I will discuss a simple algorithmic stock picking approach based on momentum and volatility. The goal will be to generate excess returns versus a capital weighted stock basket.
Alpha and Beta
Investing in assets with low volatility and high return is on a lot of peoples wish list. Portfolios which archive this goal will have a high Sharpe ratio and in the end get the investors money. By reverse engineering this criteria, one can find promising stocks to invest in and out perform a given capital weighted index.
Alpha and beta are measures to describe an assets performance relative to its index. Both are used in the CAPM – capital asset pricing model.
Alpha is a measure for an assets excess return compared to an index.
Beta is a measure for the volatility of a stock against it’s index.
In a bull market a stock with beta above 1 will have a higher volatility than the index, but also out perform this index. Unfortunately the reverse is true in a bear market. Then the positive beta (=higher volatility) will lead to an under performance of the stock in comparison to the index.
Combining Alpha and Beta
To find “quality” stocks (or any kind of assets) our algorithmic stock picking will have to combine Alpha and Beta. This can be done by calculating a volatility normalised return factor. Therefore the stock picking algorithm just divides the return of the asset over a given period by the volatility of this asset during the given period. If the stock made 25% over the last year and had a volatility of 5% it would get a volatility normalised return factor of 5.
The same is done for the index the stock is contained in. The index might have made 10% with a volatility of 3%, which would give it a performance factor of 3.
By subtracting the index factor from the stock factor, the actual volatility normalised out performance of the stock versus the index is calculated. Positive numbers will represent out performance against the index, negative numbers will represent under performance versus the index.
I originally described this approach and published the Tradesignal software suite indicator code on a different website, see it over here https://welovealgos.com/outperformance/
Algorithmic stock picking portfolio test
When using this relative performance rating to pick the best stocks, a simple portfolio can be constructed. The results are shown below.
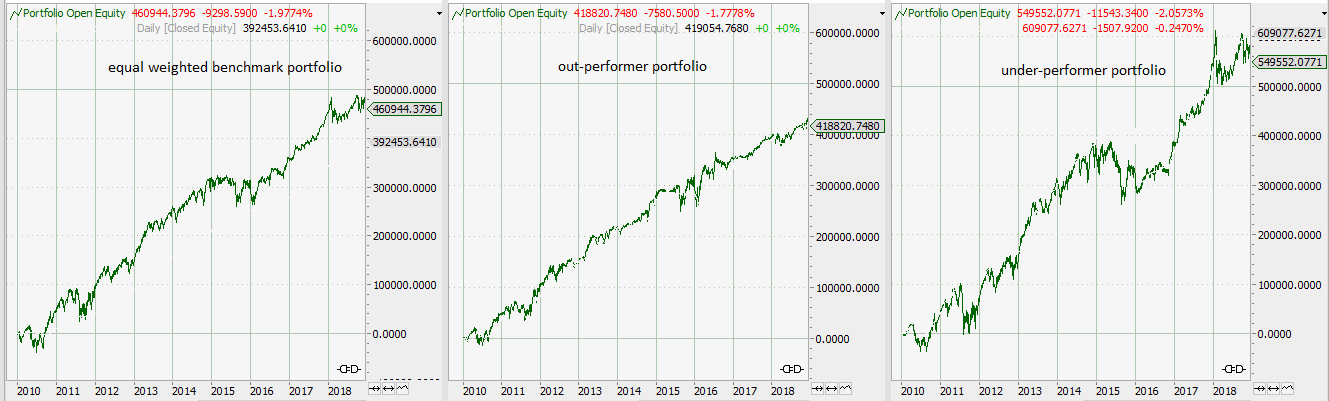
The chart on the left shows the performance of an equally weighted portfolio containing 30 stocks. All stocks are capital weighted and the portfolio is re-adjusted once a month.
The chart in the middle and the one on the right side show a portfolio build from the out-performing and under-performing stocks, using the relative performance indicator described above. The same amount of money is invested in all three portfolios.
Algorithmic stock picking results:
The results seem to be promising: the absolute return of the algorithmic stock picking portfolio in the middle of the chart are about the same as the returns of the capital weighted portfolio on the left. This return is archived with a significantly lower volatility. And as it has got a lower volatility than the benchmark portfolio, you could out-perform the original portfolio by using some leverage.
The portfolio on the right side contains the under performing stocks. It shows slightly higher absolute returns, but also a way higher volatility than the original and out-performer portfolio.
The secret of this stock picking algorithm is, that everyone is searching for low volatility an high performance assets. This can become a self fulfilling prophecy. Stocks with high returns will attract investors and most probably will be contained in some value driven ETFs. And if money flows into a market, the prices will go up…

The analysis has been done using the tradesignal software suite.