Monte Carlo Simulation uses the historic returns of your trading strategy to generate scenarios for future strategy returns. It provides a visual approach to volatility and can overcome limitations of other statistical methods.
Monte Carlo Simulation
Monte Carlo is the synonymous for a random process like the numbers picked by a roulette wheel.
The Monte Carlo Simulation does the same to your historic strategy returns. It re-arranges them in a random manner to generate new outcomes for your trading strategy. Using this approach significant properties of the original returns are kept. e.g. p/l of trades, duration of trades, flat periods, outliner trades… Classic statistics like standard deviation sometimes have problems capturing these properties, thus leading to wrong results like underestimating the future volatility of returns.
Using Monte Carlo equity projection will offer new hints on the strategies volatility and return expectations.
Re-Sampling Returns
Monte Carlo Simulation uses the historic returns to generate equity projections; e.g. instead of your historic returns of +5, -1, +6, -3, +2 Monte Carlo could lead to a series of 2, -3, -1, +5, +6. Both would have the same absolute win, but different statistical properties. Series 2 has a higher total drawdown than your original returns, a hint that you just have been lucky in the past and might want to prepare for higher volatility in the future.

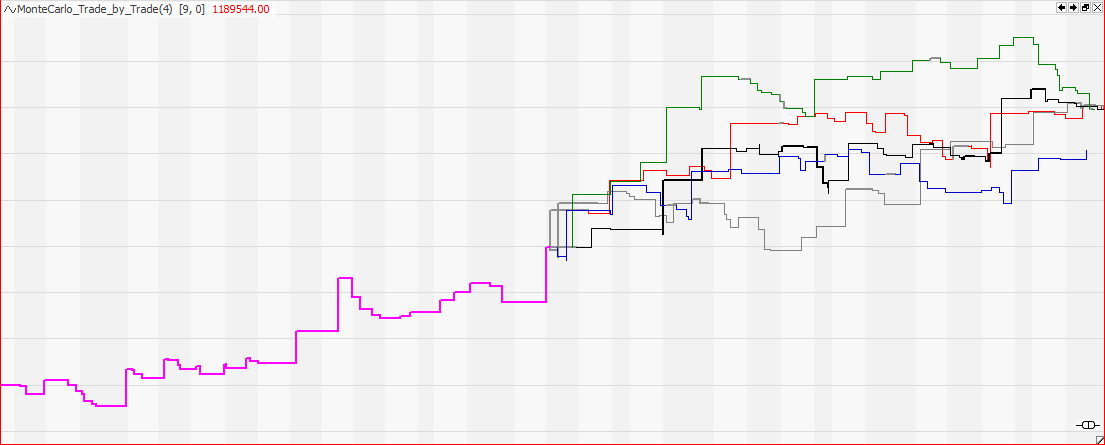
The chart above gives you an example for such a simulation.
The first half of the chart shows the closed trade returns of a trend following strategy. It consists of many small losses, a few large wins and long periods with no trades. Using these historic returns, a Monte Carlo Simulation is used to do a future projection of the strategy’s returns.
The absolute return of the Monte Carlo simulation is the same as the historic return. It contains the same trade returns and flat times as the original equity line. Just the order of the events has been randomly changed to generate new scenarios.
Loss of Edge
As we all know backtest results usually can’t be fully archived in the future. This is due to over optimization and curve fitting, things one can not avoid completely. So, in realtime trading, you will have to expect smaller wins and bigger losses when compared to the backtest results.
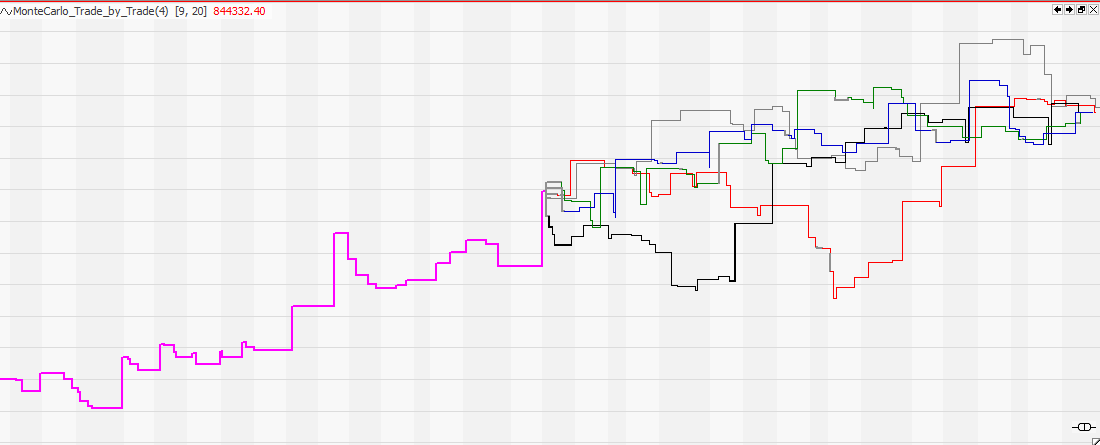
To take this effect into account I added a damping factor to the Monte Carlo simulation indicator. Set to e.g. 10%, it will reduce the size of your wins by 10% and also extend the size of your losses by 10%. This will lead to a smaller absolute return and a higher volatility of the generated equity curves.
Compare the chart below and the chart above to see the difference. In the chart above the future scenarios have the same edge as the historic returns. In the chart below the future edge is damped by 20%. As you can see this greatly expands the volatility of possible future return paths.
If you still like the outcome of the simulation, it is time to trade!
Tradesignal Indicator Code
Below the link to the indicator code for the Monte Carlo simulation. Drag and drop this indicator on a chart containing an algo trading strategy.
Using the update input you can generate a new simulation. Apply the indicator several times on the same chart to get a chart like the ones shown above. The indicator is not meant to be used with portfolios. In Moneymanagement set pyramiding to off, otherwise simulation errors might occur.
The indicator is free to use for all non commercial purposes. It might contain errors and give unexpected results. You can redistribute it and/or modify it under the terms of the GNU General Public License as published by the Free Software Foundation; either version 3, or (at your option) any later version.
Please confirm this by typing Iamaprivateinvestor as password to the code page.
For all other purposes you must contact me prior to usage.
Link to code page
The analysis has been done using the tradesignal software suite.
I have been looking for this. Thanks. How to calculate statistics of Monte Carlo results? Thank you.