When developing a new trading strategy you are usually confronted with multiple tasks: Design the entry, design the exit and design position sizing and overall risk control. This article is about how you can test the edge of your entry signal before thinking about your exit strategy. The results of these tests will guide you… Continue reading The Edge of an Entry Signal
Year: 2019
A simple algorithm to detect complex chart patterns
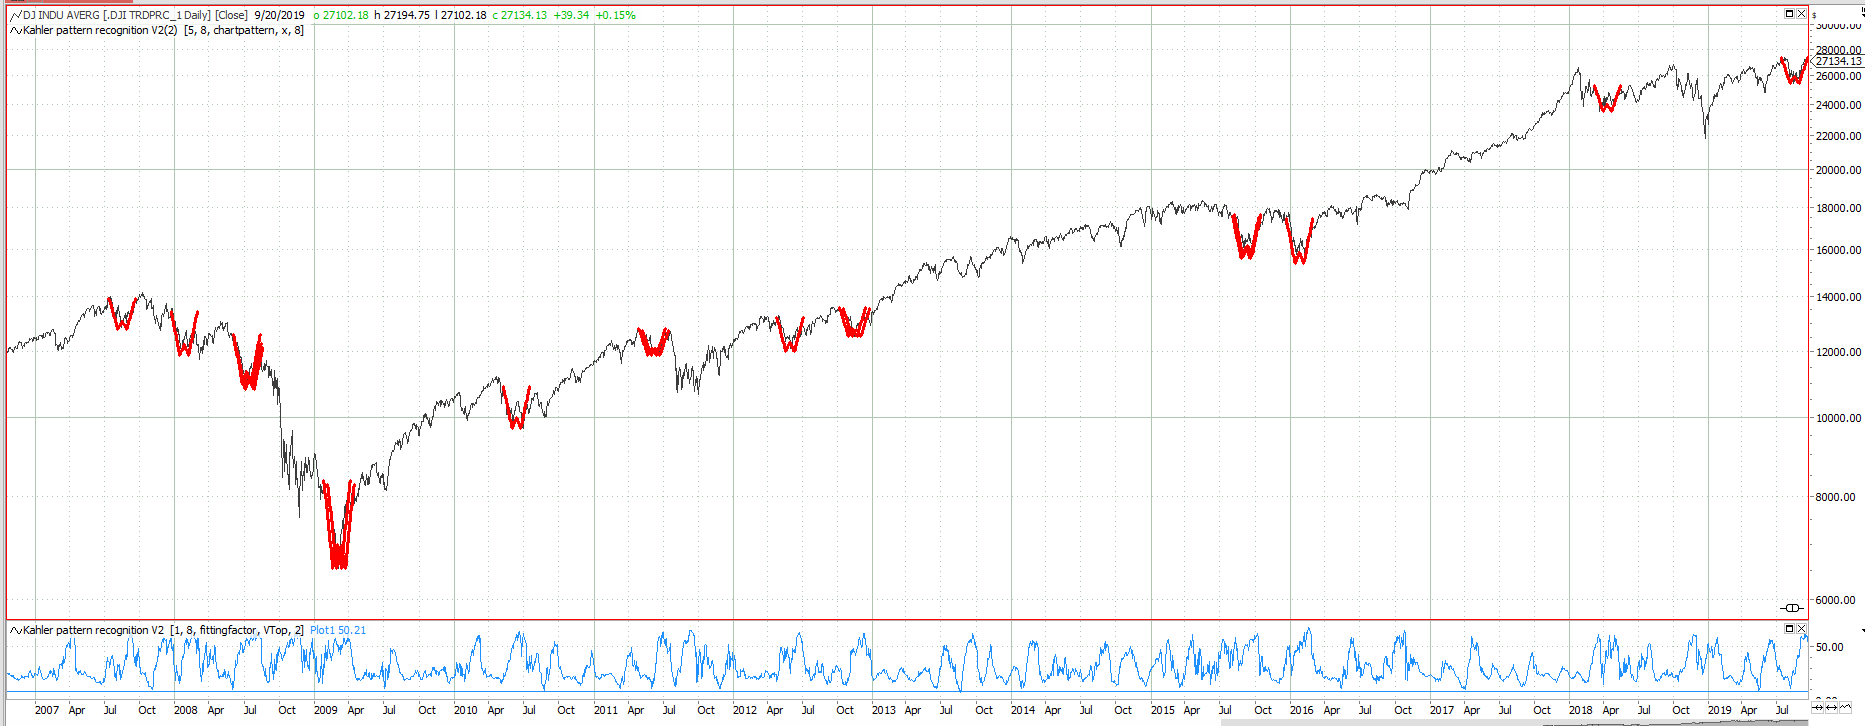
How to detect complex chart patterns in Tradesignal. See how a chart pattern is defined and how the pattern recognition algorithm is working. A free indicator code is provided.
The Probability of Normality
As an option seller you want the market to stay within the range prognosticated by implied volatility. But what is the historic probability that markets behave as expected? And what other analysis could be done to enhance your chances?
Bitcoin Swing Trading
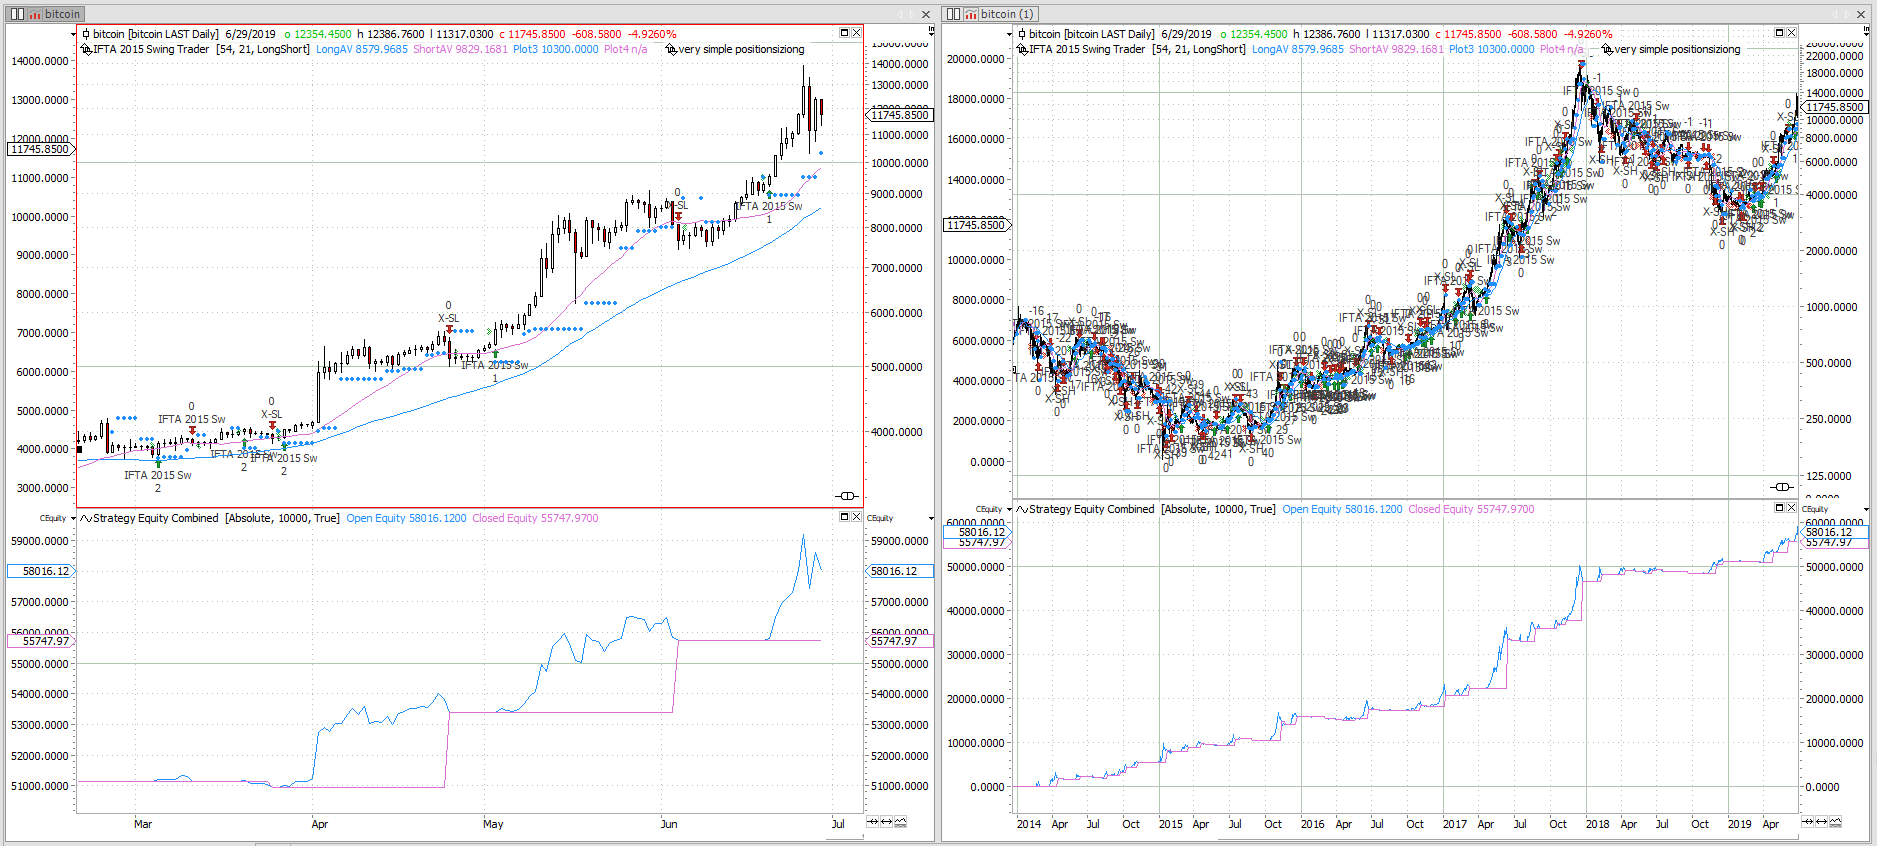
A simple bitcoin Swing Trading strategy originally published in 2015. See the out of sample performance and how it is done.
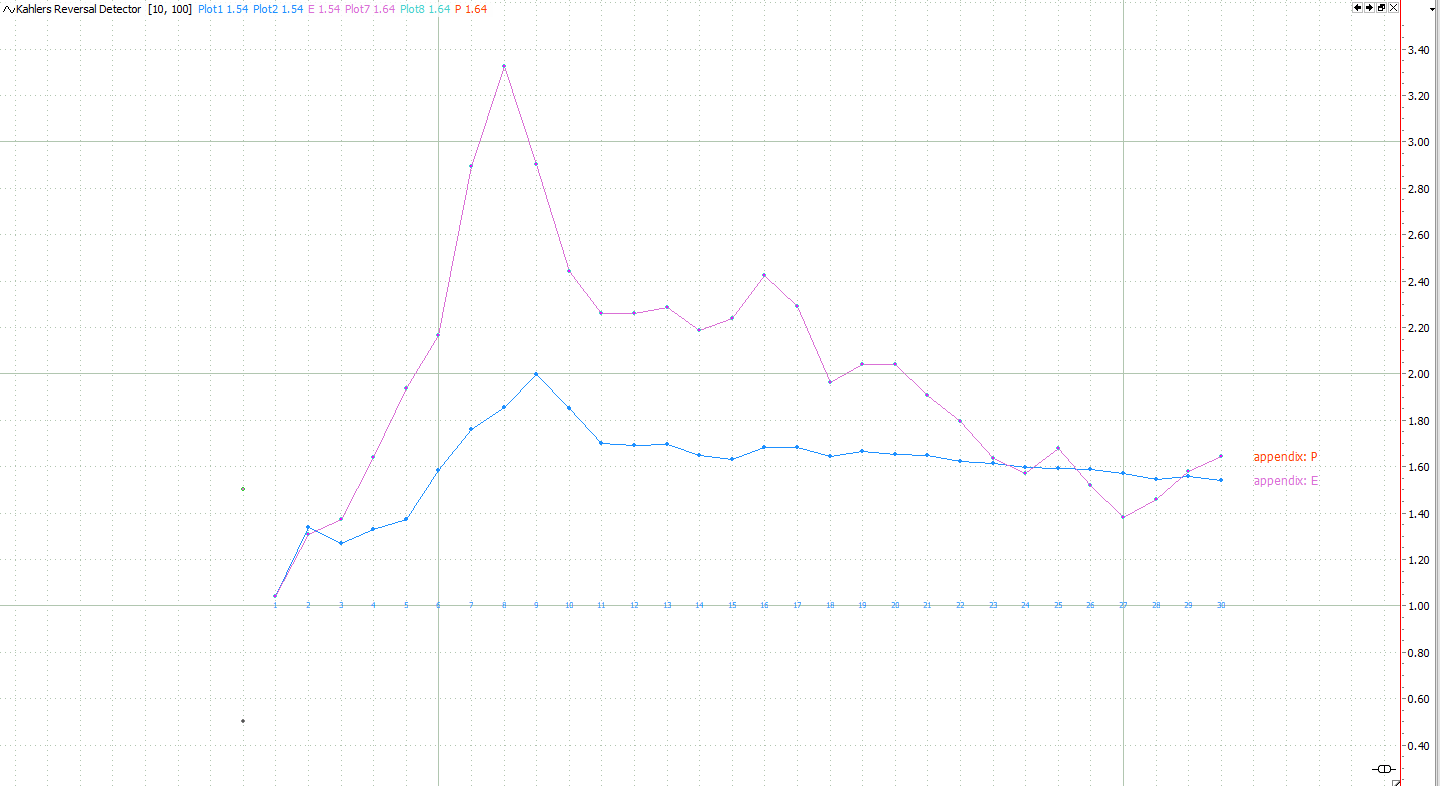
The Edge of Technical Indicators

Technical indicators are the basis of all algorithmic trading. But do these really give you an edge in your market? Are they able to define the times when you want to be invested? This article will show you a way to quantify and compare the edge of technical indicators.
Daily Extremes – Significance of time
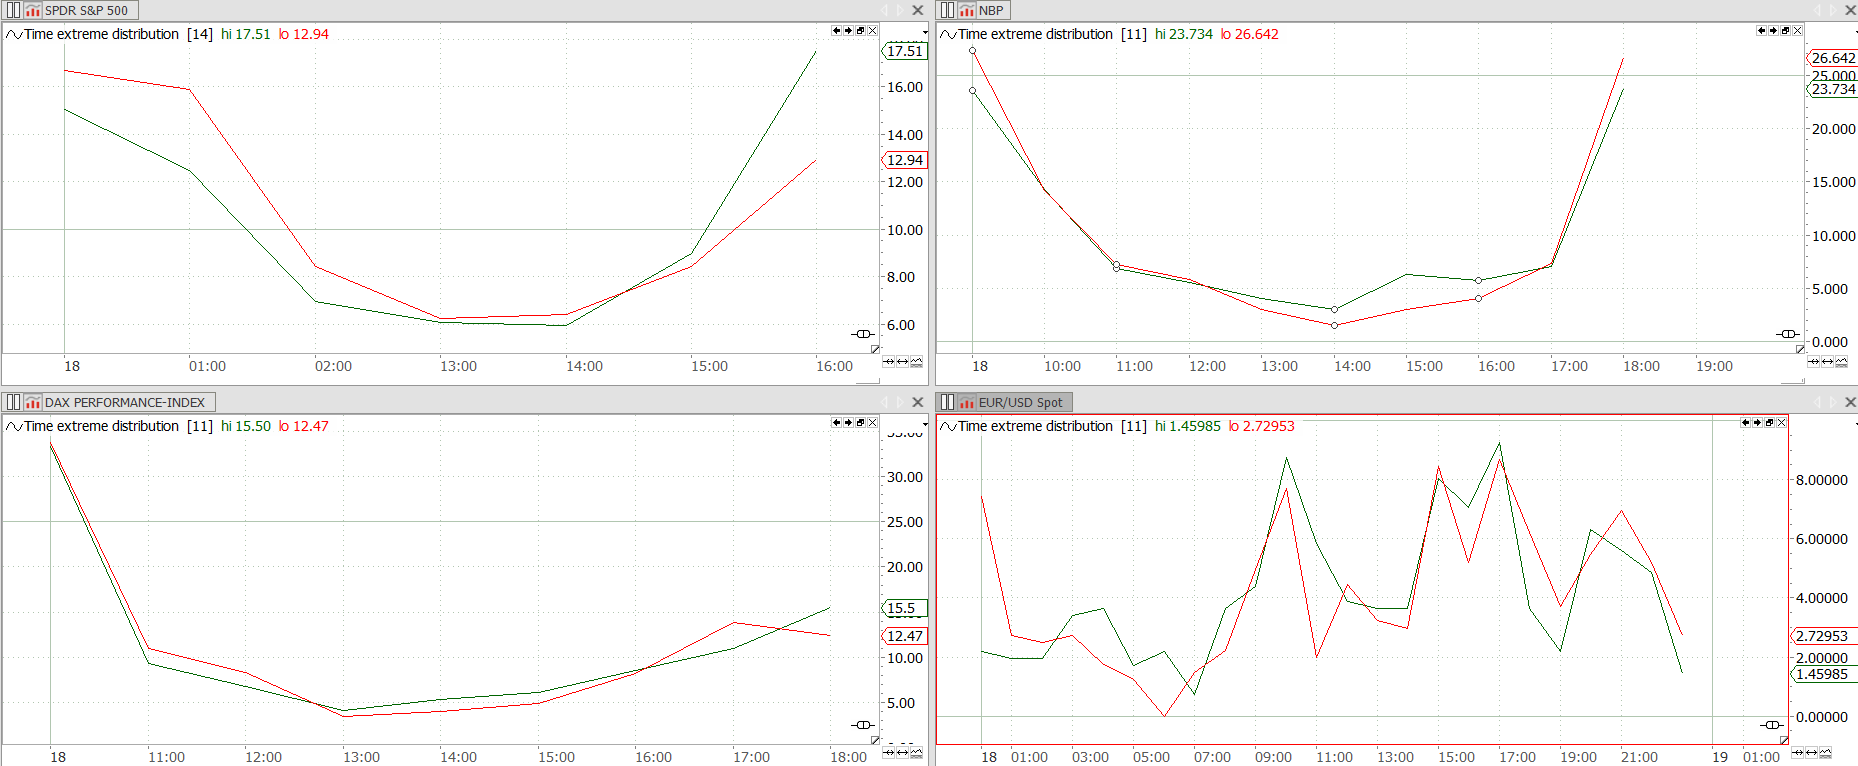
Analysing at which time daily market extremes are established shows the significance of the first and last hours of market action. See how different markets show different behaviour and see what can be learned from this analysis.
S&P500 – when to be invested
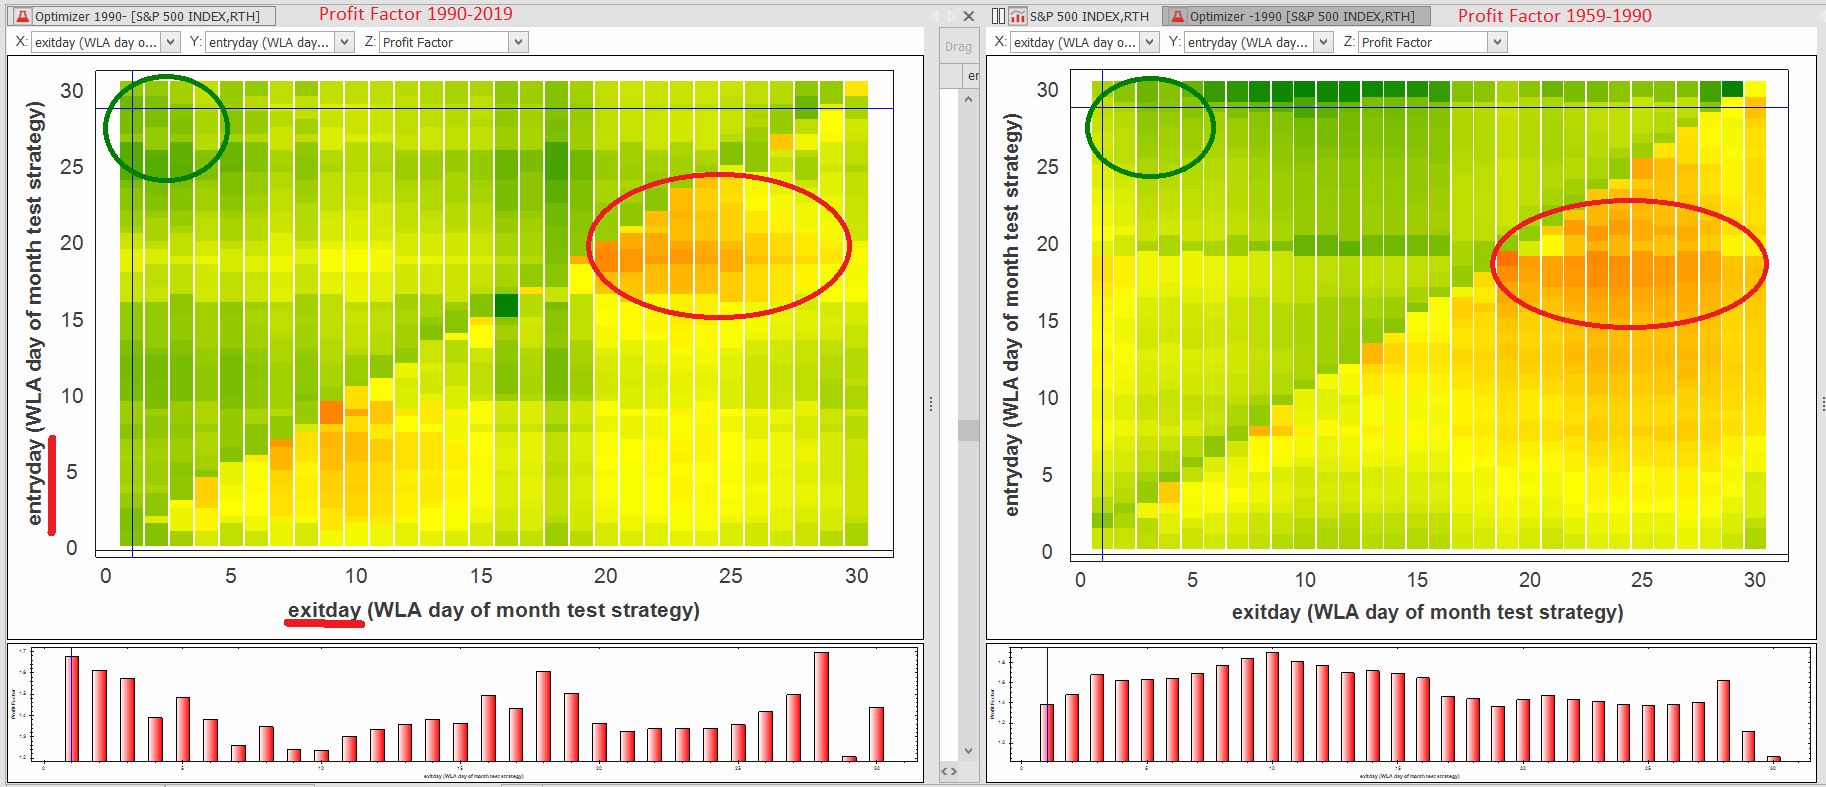
The stock market shows some astonishingly stable date based patterns. Using a performance heat map of the S&P500 index, these patterns are easily found. Date based performance The chart below shows the profit factor of a long only strategy investing in the S&P500. Green is good, red is bad. The strategy is strictly date based.… Continue reading S&P500 – when to be invested
Noisy Data strategy testing
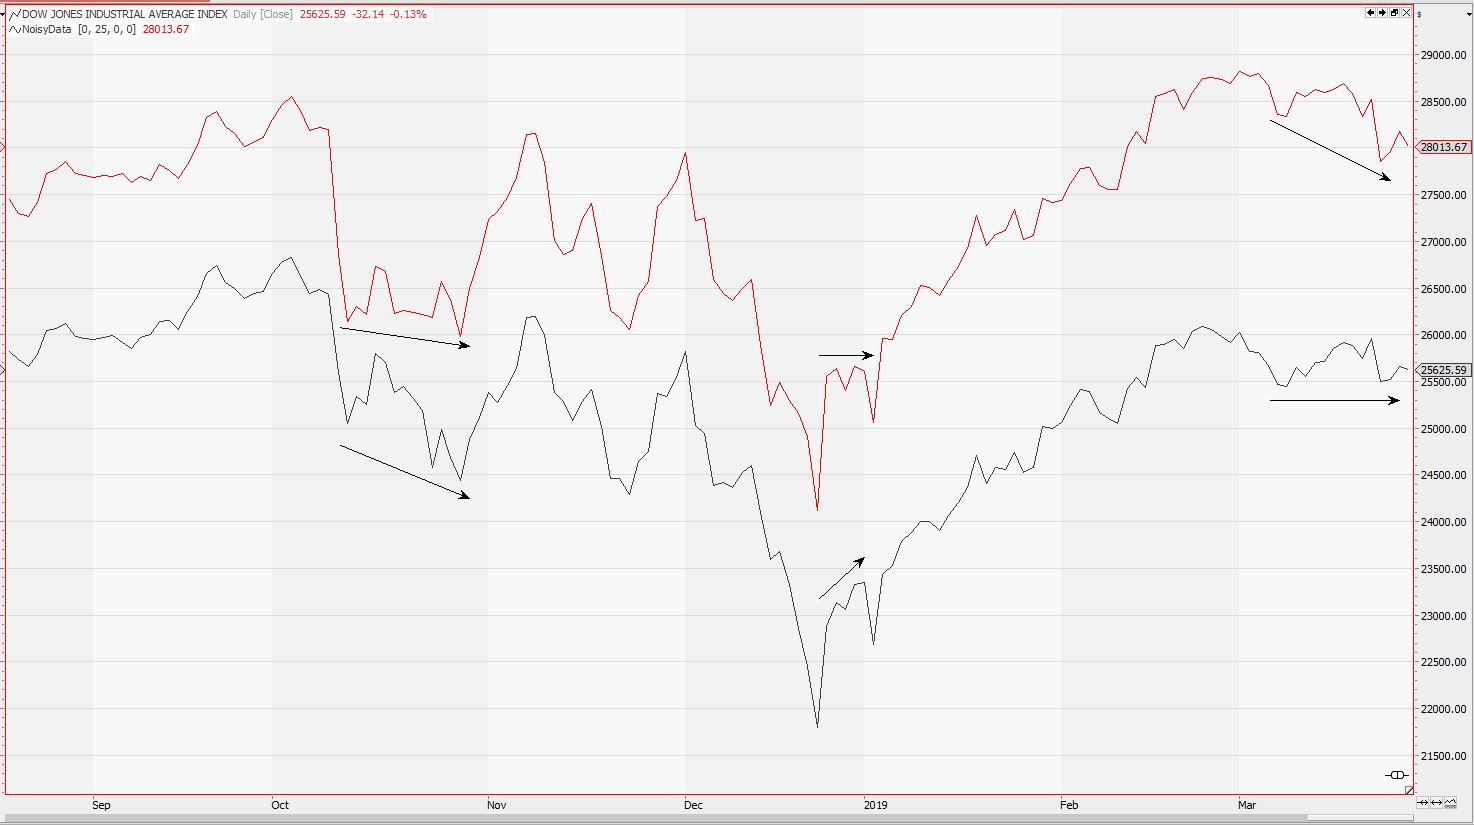
Algorithmic trading adds noise to the market we have known. So why not add some noise to your historic market data. This way you can check if your algorithmic trading strategies are fit for the future. Learn how to generate noisy data and how to test your strategies for stability in a noisy market.
Monte Carlo Simulation of strategy returns
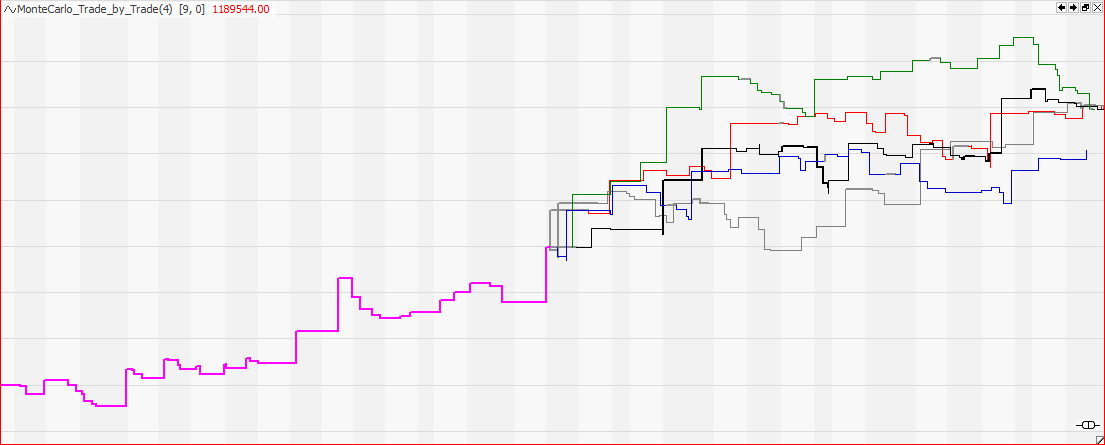
Monte Carlo Simulation uses the historic returns of your trading strategy to generate scenarios for future strategy returns. It provides a visual approach to volatility and can overcome limitations of other statistical methods. Monte Carlo Simulation
Factor investing in portfolio management
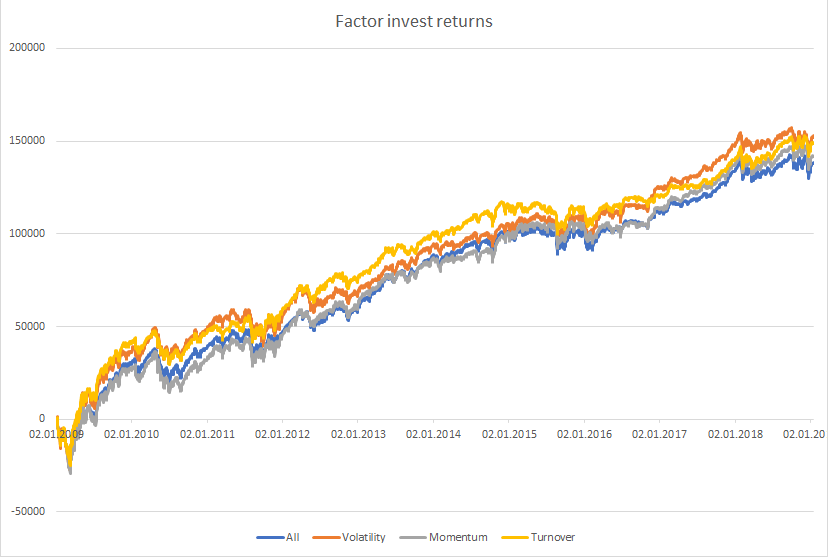
Factor investing has been around in portfolio management for some years. Based on algorithmic rules it became the big thing in trading and the ETF industry. But is there still some money to be made? Is small beta still smart or just beta? This article will give you a Tradesignal framework to test the factor… Continue reading Factor investing in portfolio management
Dollar Cost Averaging Investment Strategy – success based on luck?
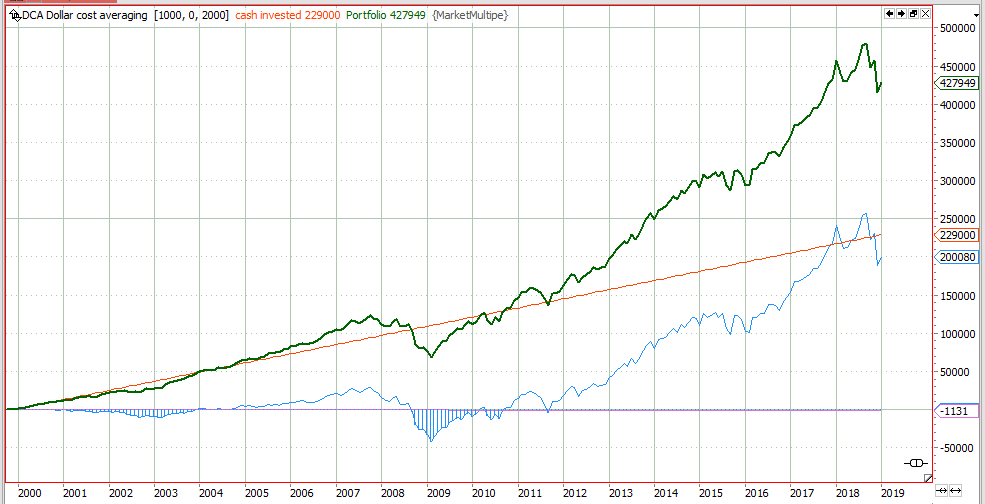
The dollar cost averaging investment strategy doubled your savings over the last 20 years, but will it continue to perform? See the facts.
Historic Bear Markets & Crashes (business as usual)
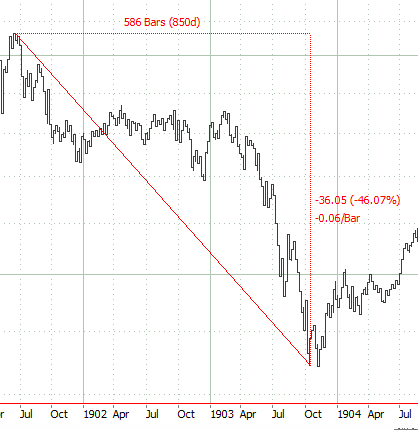
Since S&P500 has lost 20% from its top in 2018 and everybody is talking about bear markets. See what has happened in history.
Overnight vs Daytime Performance & Volatility
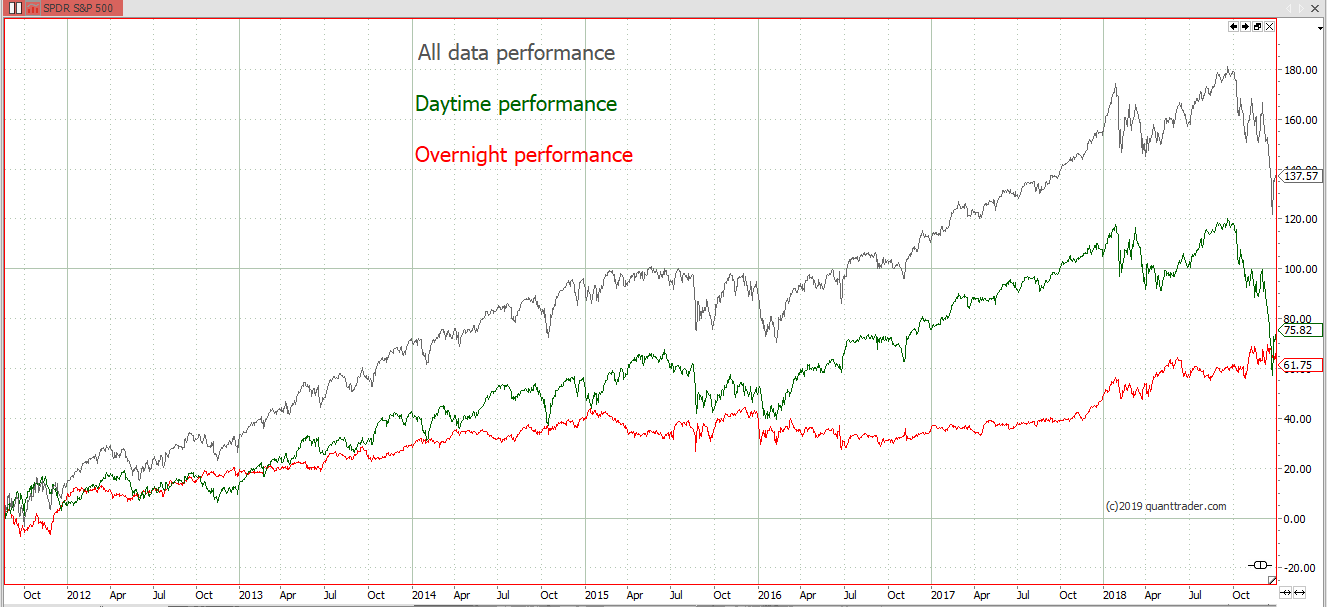
Analysing the market performance of the day session vs. the overnight movement reveals some interesting facts. Daytime vs. Overnight Performance
Pears Global Real Estate – calling the devil by its name
Maximising the net yield for the Pears family, 33 Cavendish Square, London, W1G 0LB, United Kingdom, is destroying local neighbourhoods. May they choke on their money!