If a bitchy prime minister and a crazy president weren’t enough, for the upcoming months the seasonal chart is also indicating further price setbacks.
Seasonality of DAX
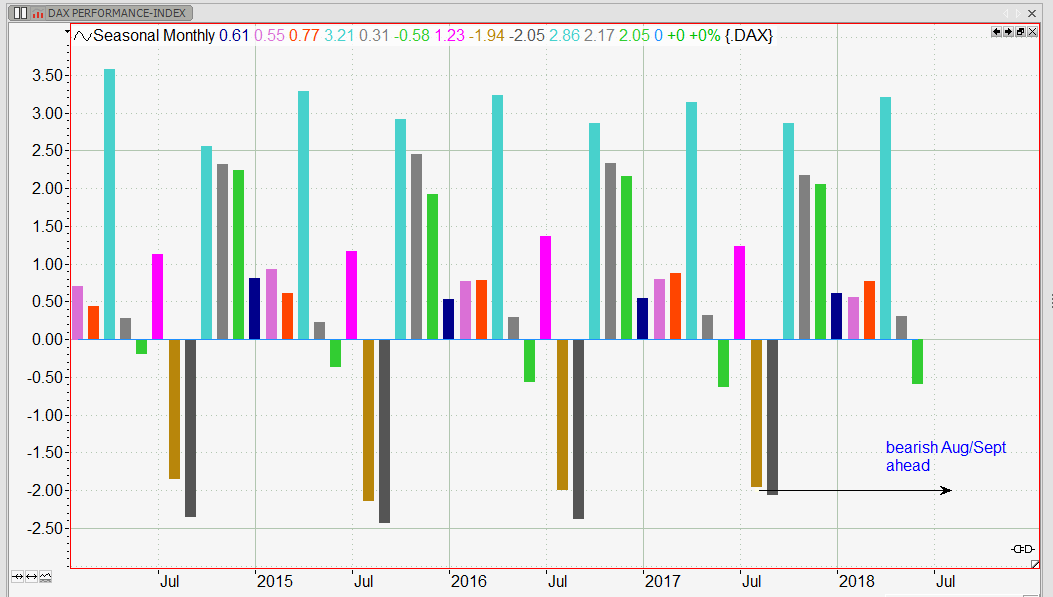
Analyzing the average monthly performance of the German DAX index a distinct pattern of seasonality can be observed. On average June has been down 0.6%, but the big trouble is yet to come.
The chart shows the average monthly performance of the DAX index, using data since 1999.
Each bar of the histogram represents a specific months percent performance. Starting with the dark blue bar in January, the green bar right now represents the average June performance.
Seasonal and Volatility Prognosis:
As you can see on the above chart June always has had a bearish prognosis over the last years. July might bring some relief (the positive magenta bar behind June), but therefore August and September surely got a strong bearish setup. Although the markets have been bullish over the last 20 years, the average combined performance of August and September is -4%.
The average performance of a month is not a good indication for the actual magnitude of the upcoming market move, it just is an indication for its direction.
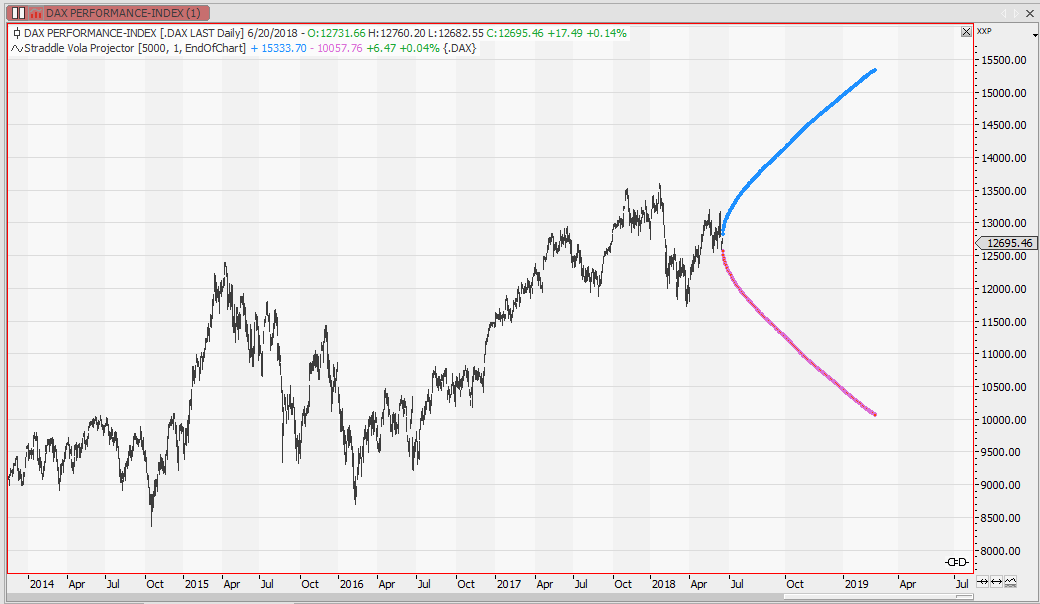
Where the move might go you can see on the market neutral volatility prognosis. The shown prognosis is based on Kvolatility and uses the DAX returns since 1999 to calculate the average expected move for the next year.
Due to reasons I have got some trouble in hoping for a move to the upper boundary of the Kvolatility projection, but I surely will structure my trades to profit from a bearish move within the next few months.
Tradesignal Equilla Indicator code:
KVolatility based volatility projection:
Meta: subchart(false);
Inputs: datapoints(250),Multi(1.0), show(Yearly,Monthly,Weekly,IntraDay,EndOfChart);
Variables: bn, start, i, rp,rc, rpsum, rcsum, returnperiod, call, put;

bn=barnumber;

if show=Yearly and year(date)<>year(date[1]) then begin
  start=bn;
  for returnperiod=1 to 250 begin
    rpsum=0;
    rcsum=0;
    for i =0 to datapoints-1 begin
      rc=maxlist((close[i]-close[i+returnperiod])/close[i+returnperiod],0); // % return of call
      rp=maxlist((close[i+returnperiod]-close[i])/close[i+returnperiod],0); // % return of put
      rcsum=rcsum+rc; // sum of all %returns over time
      rpsum=rpsum+rp;
    end;

    call=multi*rcsum*close/datapoints;
    put=multi*rpsum*close/datapoints;
    drawsymbol[-1*returnperiod](close+put+call,"+");
    drawsymbol[-1*returnperiod](close-put-call,"-");
  end;
end else

if show=Monthly and month(date)<>month(date[1]) then begin
  start=bn;
  for returnperiod=1 to 25 begin
    rpsum=0;
    rcsum=0;
    for i =0 to datapoints-1 begin
      rc=maxlist((close[i]-close[i+returnperiod])/close[i+returnperiod],0); // % return of call
      rp=maxlist((close[i+returnperiod]-close[i])/close[i+returnperiod],0); // % return of put
      rcsum=rcsum+rc; // sum of all %returns over time
      rpsum=rpsum+rp;
    end;

    call=multi*rcsum*close/datapoints;
    put=multi*rpsum*close/datapoints;
    drawsymbol[-1*returnperiod](close+put+call,"+");
    drawsymbol[-1*returnperiod](close-put-call,"-");
  end;
end else


if show=weekly and dayofweek(date)<dayofweek(date[1]) then begin
  start=bn;
  for returnperiod=1 to 5 begin
    rpsum=0;
    rcsum=0;
    for i =0 to datapoints-1 begin
      rc=maxlist((close[i]-close[i+returnperiod])/close[i+returnperiod],0); // % return of call
      rp=maxlist((close[i+returnperiod]-close[i])/close[i+returnperiod],0); // % return of put
      rcsum=rcsum+rc; // sum of all %returns over time
      rpsum=rpsum+rp;
    end;

    call=multi*rcsum*close/datapoints;
    put=multi*rpsum*close/datapoints;
    drawsymbol[-1*returnperiod](close+put+call,"+");
    drawsymbol[-1*returnperiod](close-put-call,"-");
  end;
end else

if show=intraday and dayofweek(date)<>dayofweek(date[1]) then begin
  start=bn;
  for returnperiod=1 to 100 begin
    rpsum=0;
    rcsum=0;
    for i =0 to datapoints-1 begin
      rc=maxlist((close[i]-close[i+returnperiod])/close[i+returnperiod],0); // % return of call
      rp=maxlist((close[i+returnperiod]-close[i])/close[i+returnperiod],0); // % return of put
      rcsum=rcsum+rc; // sum of all %returns over time
      rpsum=rpsum+rp;
    end;

    call=multi*rcsum*close/datapoints;
    put=multi*rpsum*close/datapoints;
    drawsymbol[-1*returnperiod](close+put+call,"+");
    drawsymbol[-1*returnperiod](close-put-call,"-");
  end;
end else

if show=EndOfChart and islastbar then begin
  start=bn;
  for returnperiod=1 to 250 begin
    rpsum=0;
    rcsum=0;
    for i =0 to datapoints-1 begin
      rc=maxlist((close[i]-close[i+returnperiod])/close[i+returnperiod],0); // % return of call
      rp=maxlist((close[i+returnperiod]-close[i])/close[i+returnperiod],0); // % return of put
      rcsum=rcsum+rc; // sum of all %returns over time
      rpsum=rpsum+rp;
    end;

    call=multi*rcsum*close/datapoints;
    put=multi*rpsum*close/datapoints;
    drawsymbol[-1*returnperiod](close+put+call,"+");
    drawsymbol[-1*returnperiod](close-put-call,"-");
  end;
end;
Seasonal Performance indicator:
Inputs: Jan(false),Feb(false),Mar(false),Apr(false),Mai(false),Jun(false),Jul(false),Aug(false),Sep(false),Okt(false),Nov(false),Dez(false);

variables: s1,s2,s3,s4,s5,s6,s7,s8,s9,s10,s11,s12,c1,c2,c3,c4,c5,c6,c7,c8,c9,c10,c11,c12,eq(0);
if bartype=bartypemonthly then begin

  if month(date)=1 then begin
    c1=c1+1; // Counter für alle Jännerbars
    s1=s1+(c-o)/o; // Summe aller Jänner Performance in %
    drawforest(0,100*s1/c1,"Jan"); // Darstellung average Jänner Performance
    if Jan then eq=eq+(c-o)/o;  // EQ in %
  end;
  if month(date)=2 then begin
    c2=c2+1;
    s2=s2+(c-o)/o;
    drawforest(0,100*s2/c2,"Feb");
    if Feb then eq=eq+(c-o)/o;
  end;
  if month(date)=3 then begin
    c3=c3+1;
    s3=s3+(c-o)/o;
    drawforest(0,100*s3/c3,"Mar");
    if Mar then eq=eq+(c-o)/o;
  end;
  if month(date)=4 then begin
    c4=c4+1;
    s4=s4+(c-o)/o;
    drawforest(0,100*s4/c4,"Apr");
    if Apr then eq=eq+(c-o)/o;
  end;
  if month(date)=5 then begin
    c5=c5+1;
    s5=s5+(c-o)/o;
    drawforest(0,100*s5/c5,"Mai");
    if Mai then eq=eq+(c-o)/o;
  end;
  if month(date)=6 then begin
    c6=c6+1;
    s6=s6+(c-o)/o;
    drawforest(0,100*s6/c6,"Jun");
    if Jun then eq=eq+(c-o)/o;
  end;
  if month(date)=7 then begin
    c7=c7+1;
    s7=s7+(c-o)/o;
    drawforest(0,100*s7/c7,"Jul");
    if Jul then eq=eq+(c-o)/o;
  end;
  if month(date)=8 then begin
    c8=c8+1;
    s8=s8+(c-o)/o;
    drawforest(0,100*s8/c8,"Aug");
    if Aug then eq=eq+(c-o)/o;
  end;
  if month(date)=9 then begin
    c9=c9+1;
    s9=s9+(c-o)/o;
    drawforest(0,100*s9/c9,"Sep");
    if Sep then eq=eq+(c-o)/o;
  end;
  if month(date)=10 then begin
    c10=c10+1;
    s10=s10+(c-o)/o;
    drawforest(0,100*s10/c10,"Okt");
    if Okt then eq=eq+(c-o)/o;
  end;
  if month(date)=11 then begin
    c11=c11+1;
    s11=s11+(c-o)/o;
    drawforest(0,100*s11/c11,"Nov");
    if Nov then eq=eq+(c-o)/o;
  end;
  if month(date)=12 then begin
    c12=c12+1;
    s12=s12+(c-o)/o;
    drawforest(0,100*s12/c12,"Dez");
    if Dez then eq=eq+(c-o)/o;
  end;
end;

drawline(100*eq,"Eq");

if bartype<>bartypemonthly and islastbar then begin
  drawtext(0,"Warning","Monatschart verwenden!",16);
end;

