
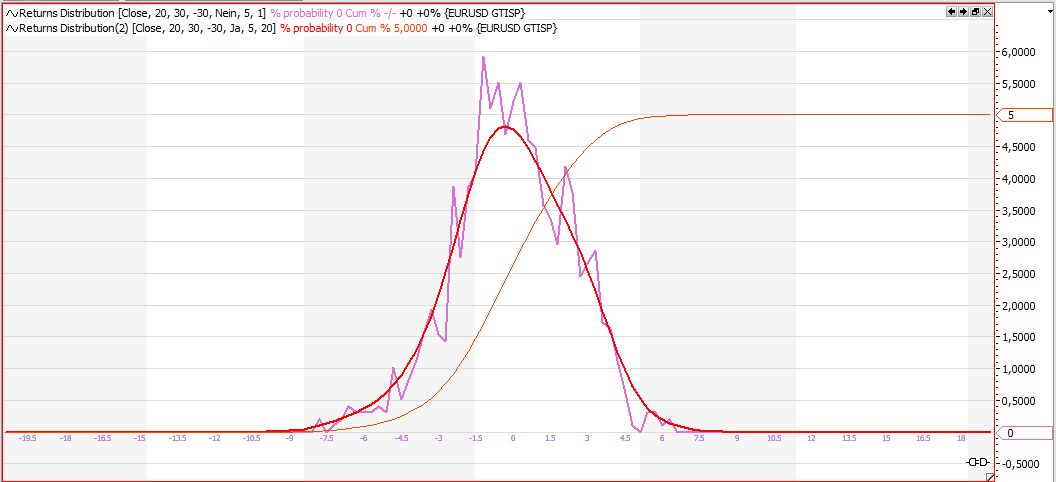
Der Returns Distribution Indikator ermöglicht es die Verteilung der Returns einer Zeitreihe darzustellen. Die Darstellung und berechnung der Returns erfolgt in Prozent.
Wird der Input “returnperiod” auf 0 gestellt, wird die absolute Preisverteilung dargestellt.
Über den Input Smooth kann die Glättung der Kurve bestimmt werden.
Zusätzlich zur Verteilung der Returns kann auch die Summe der Wahrscheinlichkeit angezeigt werden. Damit kann bestimmt werden, welche Prozentzahl von Ereignissen über oder unter einem bestimmten Wert liegen.
Beispiele zur Verwendung des Indikators: VIX, Short Trades
Tradesignal Equilla Code
// (c) 2018 kahler@quanttrader.at
Inputs: Price(close), Returnperiod(5), hh(20),ll(-20), showcumprob(true), scaleSumProbFact(1), smooth(1), mode(pct,ab);
arrays: N[200], sm[200];
Variables: r, i, j,s,s1;
Variables: tx,signal,x;
// % return over given period
// set returnperiod to 0 for absolute price distribution
if returnperiod=0 then r=price else r=iff(price[returnperiod]<>0,iff(mode=pct,100*(price-price[returnperiod])/price[returnperiod],price-price[returnperiod]),1);
if price<>price[returnperiod] then begin
for j=0 to 199 begin // sort event in right row
if r>=ll+(j)*(hh-ll)/200 and
r<=ll+(j+1)*(hh-ll)/200 then N[j+1]=N[j+1]+1;
if j=0 and r<ll then N[j+1]=N[j+1]+1; // return below min
if j=199 and r>hh then N[j+1]=N[j+1]+1; // return above max
end;
end;
if islastbar then begin
for j=1 to 200 begin // sum over probability curve
s=s+N[j];
end;
if smooth>1 then begin // smoothing
for x=1 to smooth begin
for j=1 to 200 begin
if j=1 then sm[1]=(n[1]+0.5*n[2])/1.5 else
if j>1 and j<200 then sm[j]=(0.5*n[j-1]+n[j]+0.5*n[j+1])/2 else
sm[200]=(0.5*n[199]+n[200])/1.5;
end;
for j=1 to 200 begin
n[j]=sm[j];
end;
end;
end;
for j=1 to 200 begin // draw probabilitiy curve and cum%
N[j]=N[j]/s; // norm probability curve
drawline[-j](100*N[j],"% probability");
s1=s1+N[j]; // sum probability from low to top
if showcumprob then drawline[-j](scaleSumProbFact*s1,"Cum %");
if mod(j,5)=0 or j=1 then begin
if j<>1 then tx=round(ll+j*(hh-ll)/200,2) else tx=round(ll,2);
drawtext[-j](-0.1,"%",tx);
end;
end;
end; // islastbar